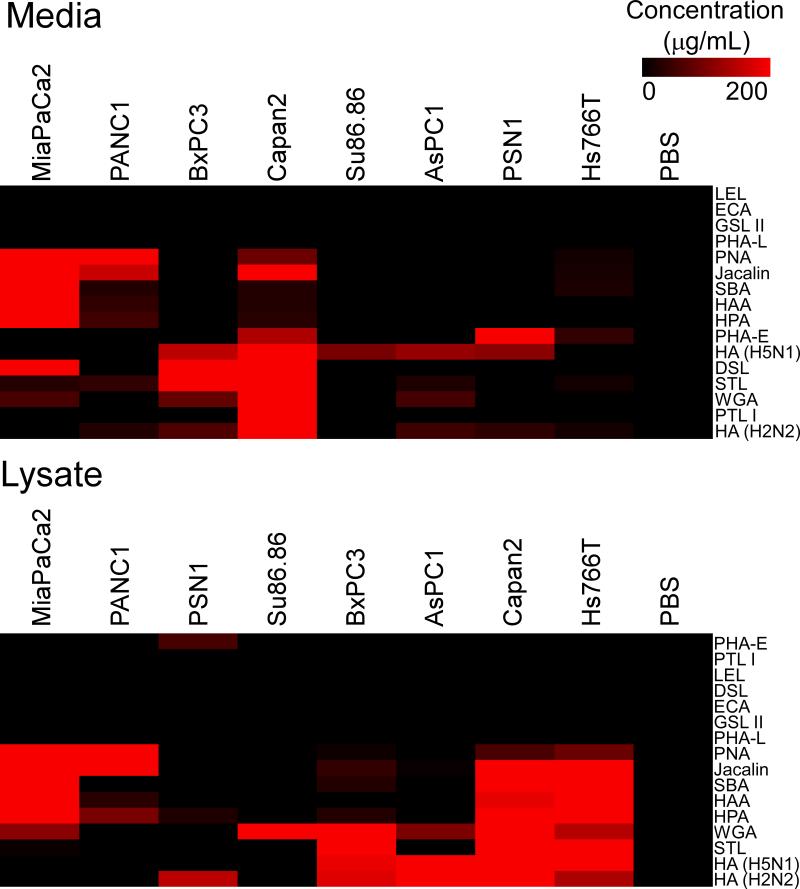
Figure 3. Lectin probing of MUC1 in cell media and lysates.
Using the scheme of Fig. 1, we incubated cell media (top) and lysate (bottom) from various cell lines (indicated by the column labels) on antibody arrays and probed the glycans on the captured proteins with various lectins (indicated by the row labels). We quantified the signal at the MUC1 capture antibody and calibrated the raw fluorescence values to the concentration of the media or lysates (scale given by the color bar) based on dilution curves (see Methods). The rows and columns are ordered according to similarity by hierarchical clustering.

