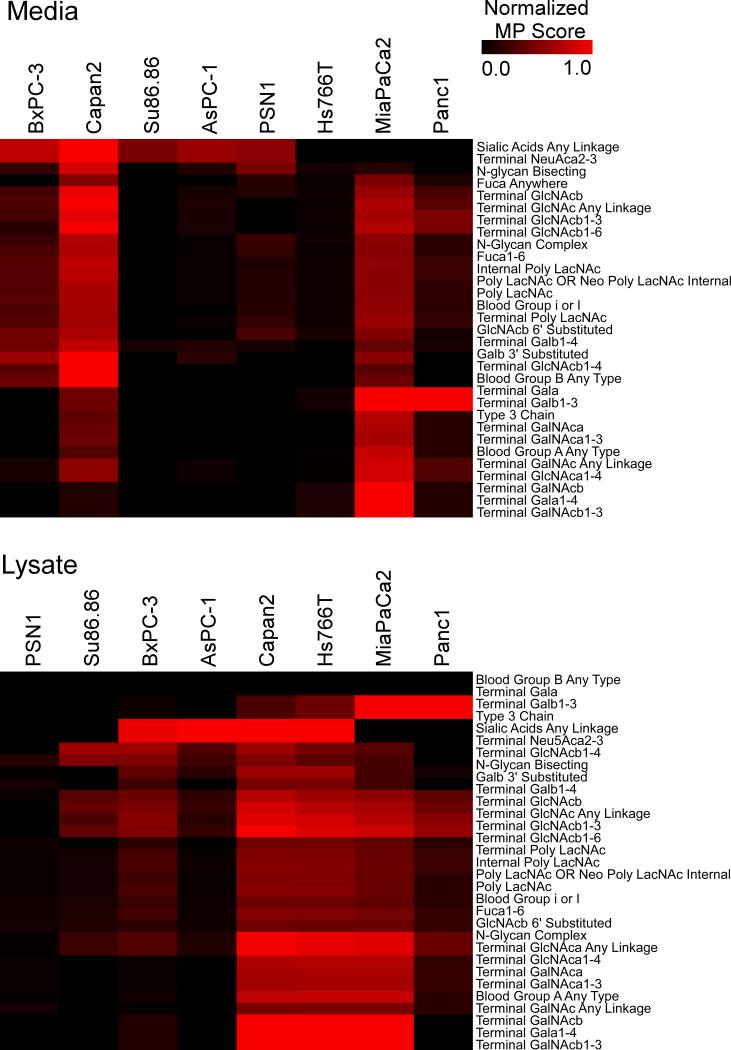
Figure 4. MUC1 glycoforms in cell media and lysates.
Using the data from Fig. 3, we converted the lectin measurements to motif predictions. The motif names appear in the row labels, and the cell line names are in the column labels. Each cell indicates the normalized motif prediction (MP) score on the scale in the color bar. To normalize the motif prediction scores, we divided each motif prediction score by the maximum potential score for the motif. The rows and columns are ordered according to similarity by hierarchical clustering.

