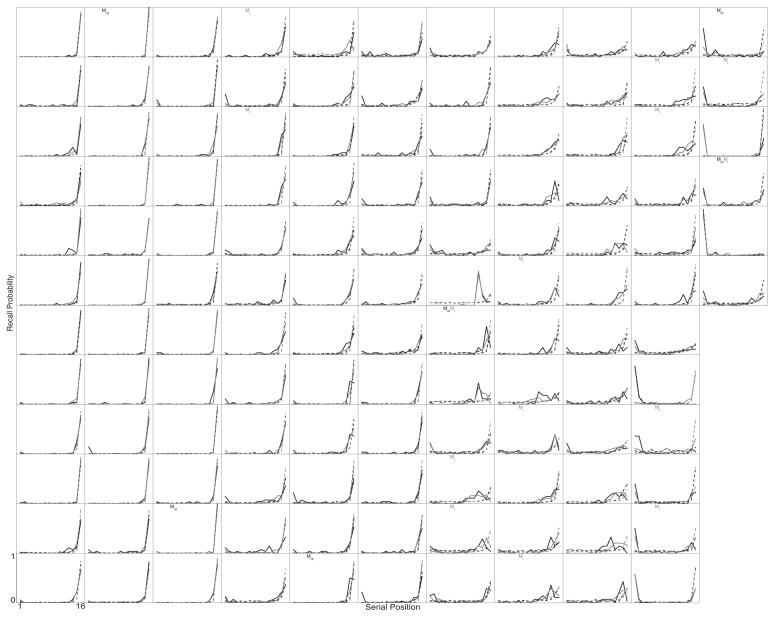
Figure 3.
Individual participants’ Probability First Recall functions. Each panel shows the data from one participant. Participants are displayed in the same order in each of Figures 2–5. Black lines show the No-Task lists, grey lines show the Task lists. Solid lines are each participant’s actual data. Dotted lines are fits of CMR to the participant’s data. A “D” in the lower left of a participant’s panel indicates that they differed significantly from the average function, an “M” indicates that CMR failed to provide a good fit to their data (see the text for details on how these determinations were made). Subscripts on “D’s” and “M’s” indicate list type: “t” indicates Task lists, “nt” indicates No-Task lists.

