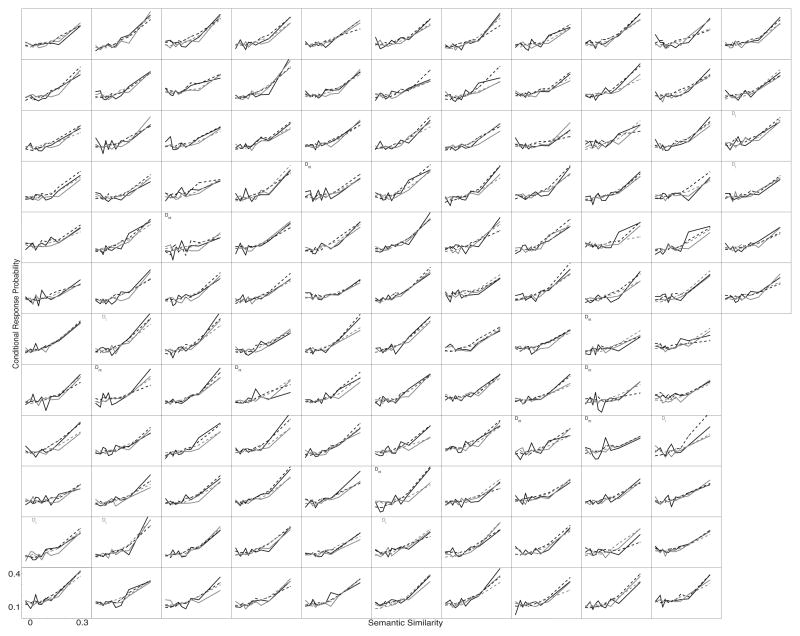
Figure 5.
Individual participants’ Semantic-Conditional Probability functions. Each panel shows the data from one participant. Participants are displayed in the same order in each of Figures 2–5. Black lines show the No-Task lists, grey lines show the Task lists. Solid lines are each participant’s actual data. Dotted lines are fits of CMR to the participant’s data. A “D” in the lower left of a participant’s panel indicates that they differed significantly from the average function, an “M” indicates that CMR failed to provide a good fit to their data (see the text for details on how these determinations were made). Subscripts on “D’s” and “M’s” indicate list type: “t” indicates Task lists, “nt” indicates No-Task lists.

