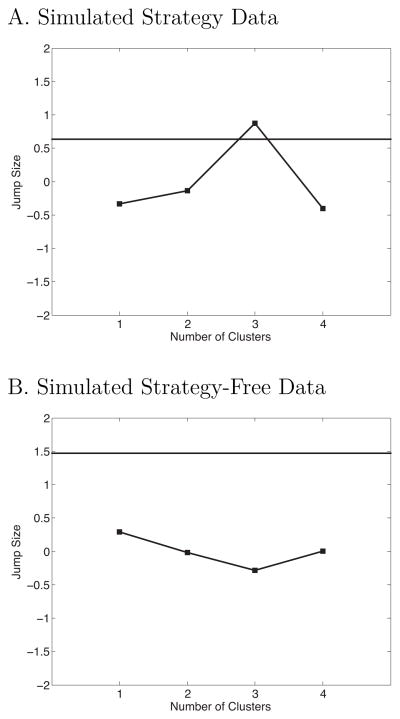
Figure 7.
Results of cluster detection analyses for simulated participants. A. The results of the procedure applied to a sample composed of 31 simulated primacy participants and 95 simulated recency participants. B. The results of the procedure applied to a sample composed of 126 participants all drawn from a distribution that shows both primacy and recency. The solid horizontal lines show the upper bound of a 95% confidence interval on the jump value for k = 1, if the jump value for any k exceeds this bound, we can reject the hypothesis that the data contains a single cluster, with the peak of the function indicating the appropriate number of clusters.

