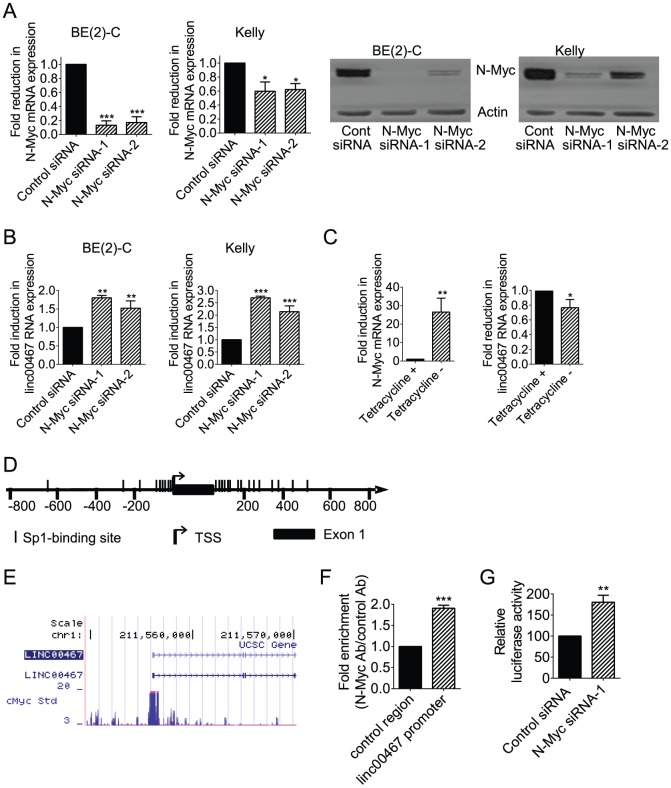
Figure 1. N-Myc represses linc00467 gene expression by direct binding to the linc00467 gene promoter.
(A–B). BE(2)-C and Kelly cells were transfected with scrambled control (Cont) siRNA, N-Myc siRNA-1 or N-Myc siRNA-2 for 48 hours, followed by RNA and protein extraction, real-time RT-PCR and immunoblot analyses of N-Myc mRNA, protein expression (A) or linc00467 RNA expression (B). (C) SHEP-21N cells were incubated with or without tetracycline for 48 hours, followed by RNA extraction and RT-PCR analysis of N-Myc and linc00467 RNA expression. (D) Schematic representation of the linc00467 gene promoter. TSS represented transcription start site, and | represented Sp1-binding sites. (E) ChIP-Seq data from Dr. Michael Snyder's group at Yale University for the ENCODE/SYDH project generated from K562 cells. (F) ChIP assays were performed with a control or anti-N-Myc antibody (Ab) and primers targeting a negative control region or the linc00467 gene core promoter region enriched in Sp1-binding sites in BE(2)-C cells. Fold enrichment was calculated by dividing PCR products from DNA samples immunoprecipitated with the anti-N-Myc Ab by PCR products from DNA samples immunoprecipitated with the control Ab, relative to input. Fold enrichment at the negative control region was artificially set as 1.0. (G) BE(2)-C cells were transfected with control siRNA or N-Myc siRNA-1, followed by co-transfection with Cypridina TK control construct plus empty vector or linc00467 gene promoter pLightSwitch_Prom construct. Luciferase activities were measured with a LightSwitch Dual Assay System kit, and expressed as a percentage change relative to control siRNA transfected samples. Error bars represented standard error. *, ** and *** indicated P<0.05, 0.01 and 0.001 respectively.

