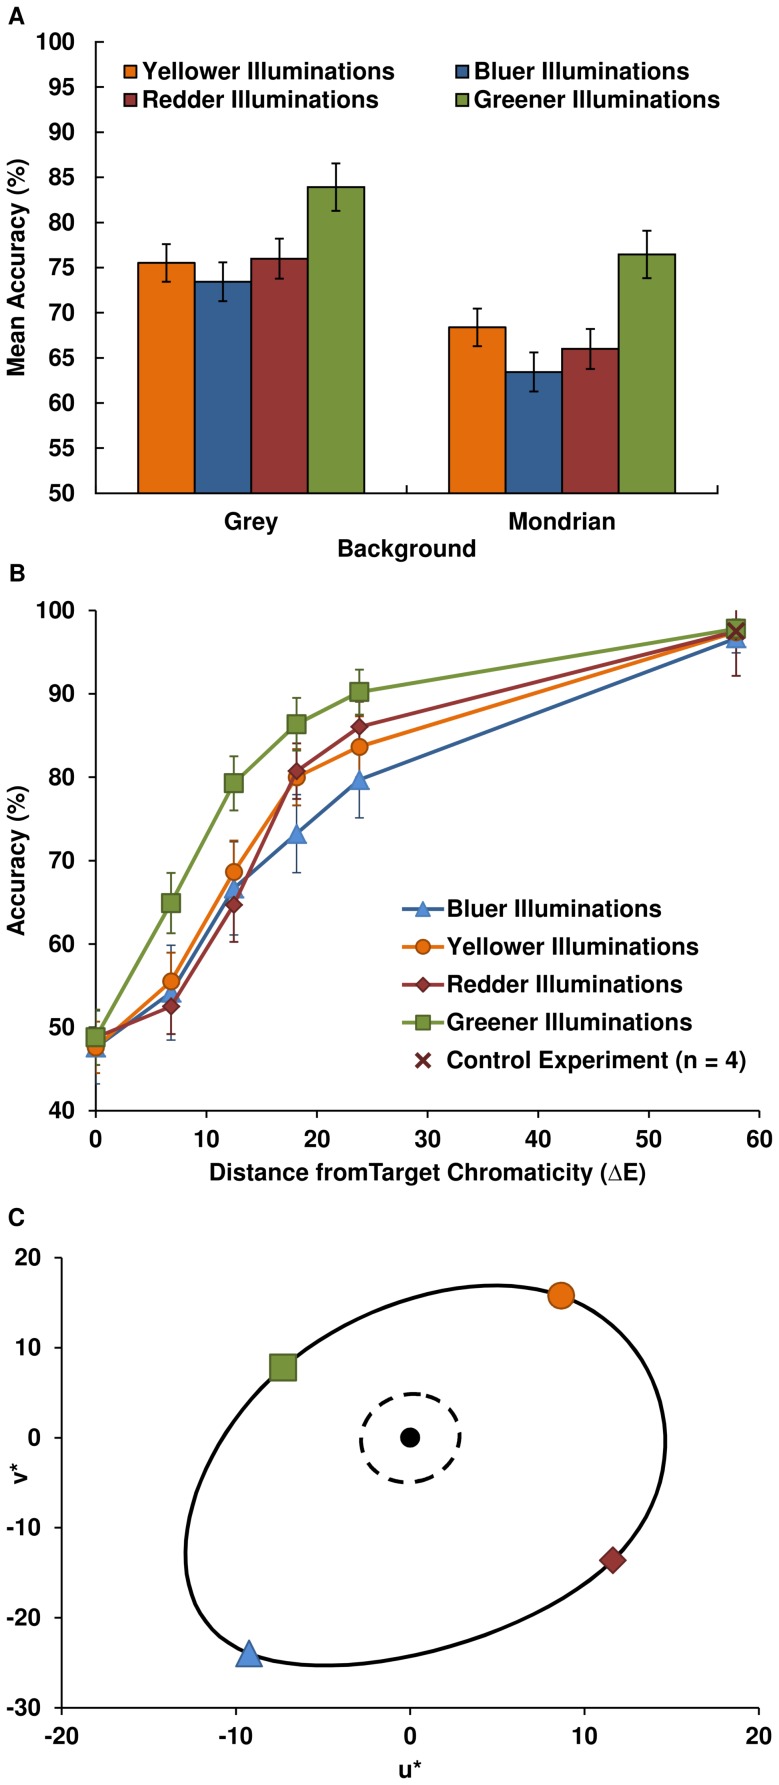
Figure 2. Mean discrimination accuracy for various conditions.
A. Mean discrimination accuracy for illuminations by their chromatic direction, for conditions using the grey or Mondrian background; for significant differences see main text. B. Mean accuracy across all conditions and participants for each chromatic direction as a function of perceptual distance from the target chromaticity ΔEuv. C. Computed ΔEuv mean thresholds at 75% accuracy for each chromatic direction, plotted in CIE u*v* colour space, with a spline forming the just-noticeable-difference discrimination contour (bold line) from D67 (black marker); just-noticeable-difference MacAdam ellipse boundary for D65 (dashed line) plotted around D67 point.

