Fig. 5.
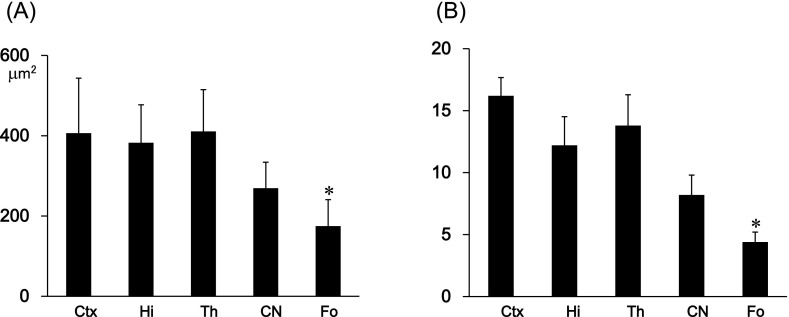
Quantitative analysis of podoplanin-positive cells in the mouse brain. (A) Area of podoplanin and GFAP double positive cells in the cerebral cortex (Ctx), hippocampus (Hi), thalamus (Th), caudate nucleus (CN), and fornix (Fo). The areas of podoplanin-positive cells in the fornix were statistically significantly smaller than other areas. There were no differences in the tested areas except for the fornix. Data are expressed as means±SD. *Significantly different (p<0.01). (B) Number of podoplanin and GFAP double positive cells in the cerebral cortex (Ctx), hippocampus (Hi), thalamus (Th), caudate nucleus (CN), and fornix (Fo). Average of the number of cells in five spots (75 µm2×75 µm2) in the fornix were statistically significantly fewer than in other areas. There were no differences in the tested areas except for in the fornix. Data are expressed as means±SD. *Significantly different (p<0.01).

