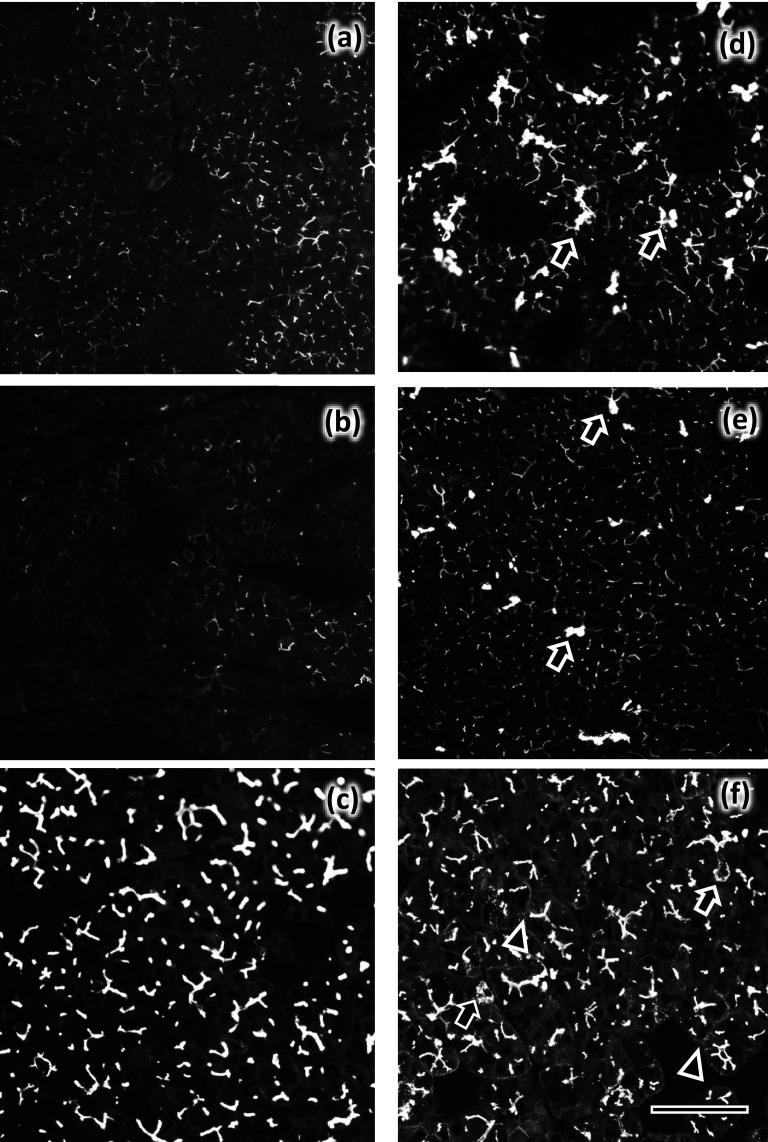
Fig. 3.
Changes in the fluorescence intensity of AQP5-labeling in pilocarpine- or IPR-treated salivary glands. Parotid and submandibular glands are shown in the left and right columns, respectively. Control, pilocarpine-administered, and IPR-administered glands are shown in the upper, middle, and lower panels, respectively. Fluorescent images were captured and processed under identical conditions and representative images are shown. Arrows indicate intercalated ducts. The AQP5 labeling intensity is highly increased in IPR-administered parotid (c) and submandibular (f) glands, but decreased in pilocarpine-administered parotid (b) and submandibular (e) glands. AQP5 labeling is mainly restricted to the apical membrane. However, faint labeling was evident on the basolateral membrane of IPR-administered submandibular glands (arrowheads in f). Bar=100 µm.

