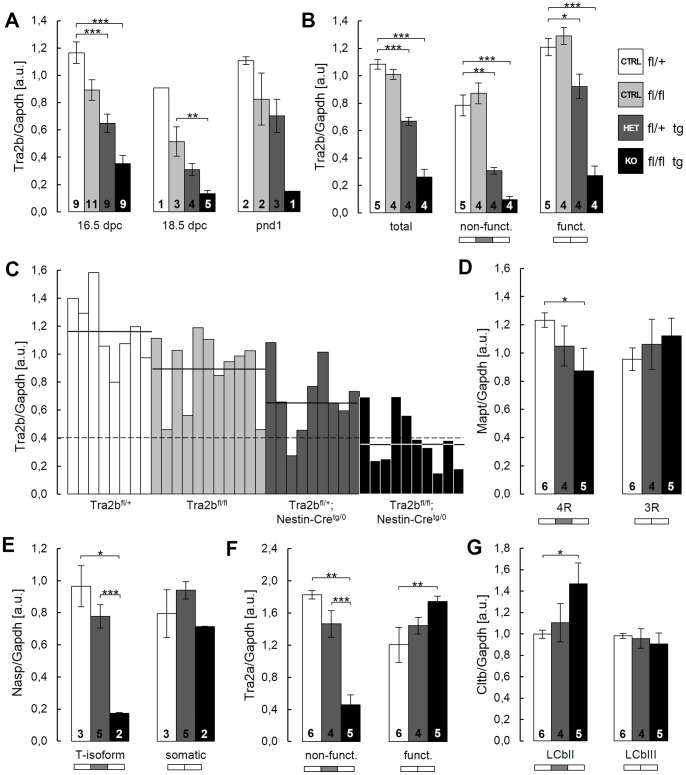
Figure 3. Bona fide Tra2b-related splicing events can be detected in vivo in conditional Tra2b knock-out mice.
(A–G) Quantitative real-time PCR using whole brain RNA of control, HET and KO embryos at 16.5 dpc. All mRNA levels have been normalized to Gapdh. (A) Total Tra2b expression levels are effectively reduced in KO animals at 16.5 dpc, 18.5 dpc and PND1. (B) Expression levels of both the functional and non-functional Tra2b isoforms are reduced at 16.5 dpc. (C) Individual expression levels of total Tra2b largely behave accordingly to the respective genotype but are subject of variation within each group. Horizontal lines indicate the mean of each genotype group. The dashed line indicates a threshold value of 0.4. (D) Expression levels of the 3R and 4R isoforms of the Mapt transcript. Transcript levels of the 4R isoform are reduced in KO brains. (E) Expression levels of the LCbII and LCbIII isoforms of the Cltb transcript. Transcript levels of the LCbII isoform are reduced in KO brains. (F) Expression levels of the somatic and the testis-related isoform of the Nasp transcript. Transcript levels of the testis-specific T-isoform are drastically reduced by −5.5-fold in KO brains. (G) Expression levels of the functional and non-functional isoform of the Tra2a transcript. Transcript levels of the non-functional isoform are drastically reduced by −4.0-fold and levels of the functional isoform are increased by +1.4-fold. Mapt, microtubule associated protein tau; Cltb, Clathrin light chain b; Nasp, Nuclear autoantigenic sperm protein; Tra2a, Transformer 2 alpha; a.u., arbitrary units; error bars indicate the s.e.m.; significance levels are *p<0.05, **p<0.01, ***p<0.001 (Student’s t-test); N is given by numbers within bars.

