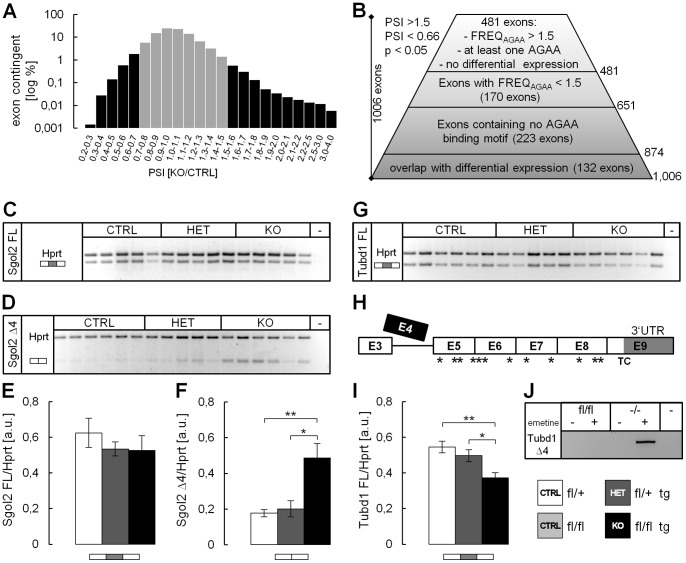
Figure 4. Mouse whole exon array analysis reveals Tubd1 exon4 and Sgol2 exon4 as in vivo targets of Tra2b.
Whole brain RNA of 4 CTRL animals and 4 KO animals was analyzed on mouse exon array. (A) The inclusion ratio (PSI, percent splicing inclusion) of each identified exon is defined as [PSI_KO]/[PSI_CTRL]. PSI distribution reached from ∼0.2 until ∼4.0. (B) Initial filtering strategies comprised exclusion of PSIs between 0.66 and 1.5 (grey bars) as well as restriction to p-values smaller than 0.05 which yielded a total of 1,006 exons. Exons associated with transcripts identified as being transcriptionally up- or downregulated were excluded from analysis. Ranking of those was further refined using large PSI values and considering presence of putative Tra2b binding sites (AGAA-motifs). Thereby, exons had to contain at least a single AGAA-site and a AGAA-frequency higher than 1.5. (C,D,G,H) Semi-quantitative RT-PCT on whole brain RNA was carried out using isoform specific primers for Sgol2 FL (C), Sgol2 Δ4 (D), Tubd1 FL (G) and Tubd1 Δ4 (H) confirming splicing events identified on the microarray. All isoform expression levels were densitometrically measured and normalized against Hprt (E,F,I). The Tubd1 Δ4 isoform could not be detected using whole brain RNA, as skipping of exon4 introduces numerous premature termination codons leading to nonsense-mediated decay of the transcript (H). Treatment of wt and Tra2b-depleted murine embryonic fibroblasts with emetine successfully inhibited NMD and the Tubd1 Δ4 isoform was detectable in Tra2b-depleted cells only (J). FL, full length; Δ4, transcript lacking exon 4, (−) PCR negative control; a. u., arbitrary units; error bars show the s.e.m.; significance levels are *p<0.05, **p<0.01, ***p<0.001 (Student’s t-test).

