
Figure 1. Different concentration-response characteristics in dendrites and somata of antennal lobe (AL) projection neurons (PNs).
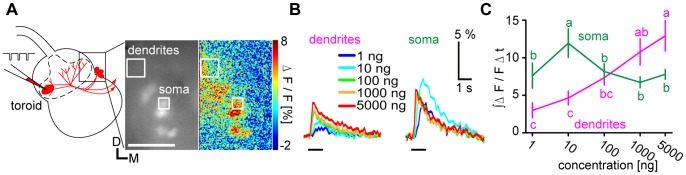
A, Schematic diagram of loading a calcium indicator into PNs with a micropipette by local electroporation (left). The toroid glomerulus processing bombykol is delineated by a dashed line. Fluorescence images of labeled PNs (middle) and the response to 1000 ng bombykol in false colors (right) are shown. Dendritic and somatic regions of interest (ROIs) are indicated by boxes. D: dorsal, M: medial. Scale bar: 50 µm. B, Representative time courses of PN responses to bombykol stimuli in the dendrites (left) and a soma (right). Black bars under time courses indicate the stimulus. C, Concentration-response characteristics of PN dendrites (magenta) and somata (green). Calcium responses were integrated over 3 s from stimulus onset. (P<0.05 for significant differences indicated by different letters associated with the data groups shown as means±SEM, n = 6 for dendrites and n = 17 for somata, one-way repeated measures ANOVA followed by Tukey-Kramer test).