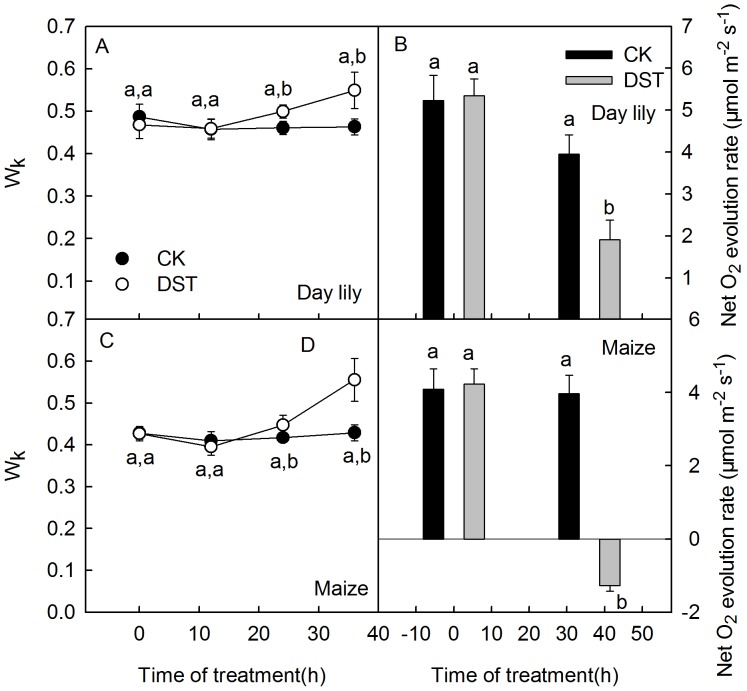
Figure 3. Wk and net O2 evolution rate in leaves during dark-submergence treatment.
The relatively variable fluorescence at the K step (WK) and net O2 evolution rate in the daylily (A, B) and maize (C, D) leaves during dark-submergence treatment (DST). Means ± SE of eight replicates are presented. Different letters indicate significant differences between the treatments, P<0.05. Differences were analyzed by least significant difference (LSD).

