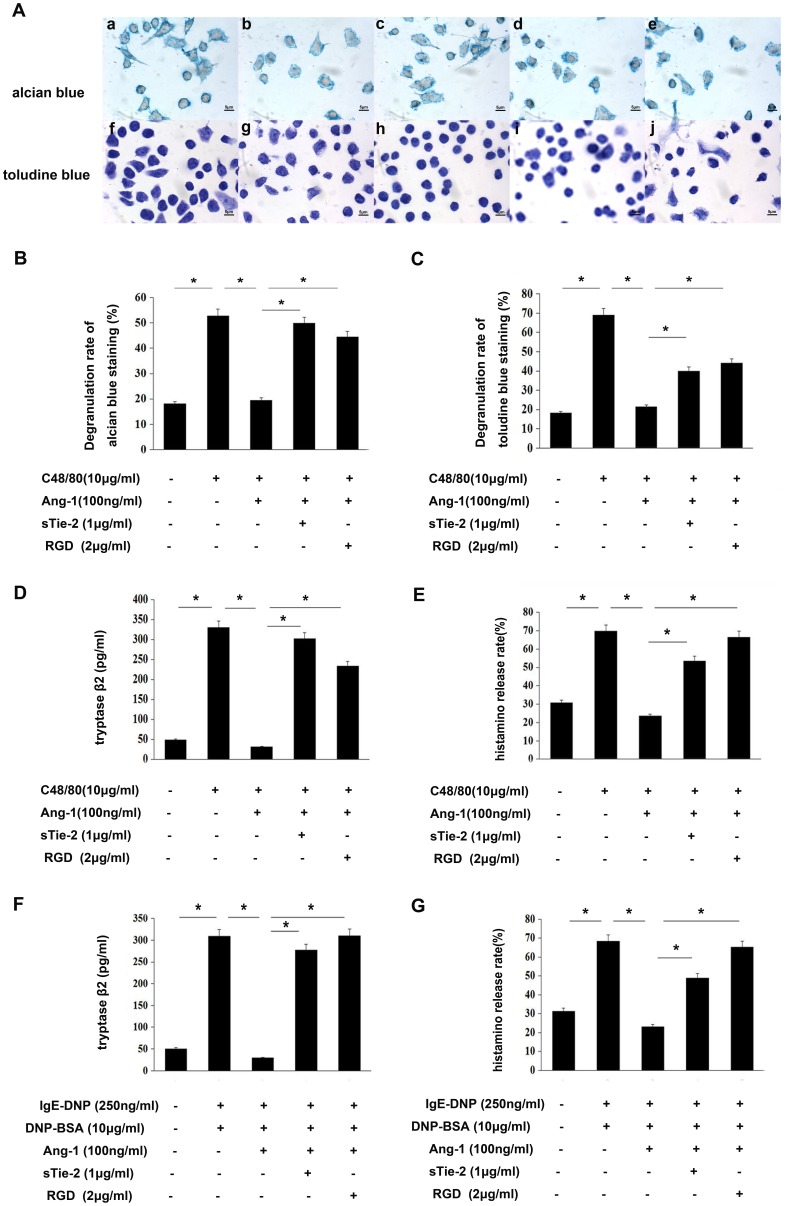
Figure 3. Ang-1 suppressed compound 48/80 induced mast cells degranulation.
Degranulation was determined by staining with dyes and measuring the release of histamine and tryptase. A: Mast cells degranulation was observed by microscope 20 min after compound 48/80 10 µg/mL treatment. Cells were stained with alcian blue (a–e) and toluidine blue (f–j) (100×). (a, f) control group; (b, g) compound 48/80-treated cells; (c, h) Ang-1 100 ng/ml-treated cells; (d, i) Soluble form of Tie2 (sTie-2)-treated cells and (e, j) RGD-treated cells. B and C: Quantification of P815 mast cells degranulation by compound 48/80. It was performed in a blinded fashion. D: Degranulation stimulated by compound 48/80 was determined by measuring the release of tryptaseβ2 (mMCP-6) through commercial ELISA kit in duplicates. The data shown are mean±SD of 3 separate experiments. E: Degranulation stimulated by compound 48/80 was determined by measuring the release of histamine through OPT-fluorometric assay as previously reported in duplicates. F: Mast cells degranulation were incubated with 250 ng/ml before DNP-BSA 10 µg/ml treatment for 20 min. Degranulation was determined by measuring the release of tryptase-β2 (mMCP-6) through commercial ELISA kit in duplicates. The data shown are mean ±SD of 3 separate experiments. G: Mast cells degranulation were incubated with 250 ng/ml before DNP-BSA 10 µg/ml treatment for 20 min. Degranulation was determined by measuring the release of histamine through OPT-fluorometric assay as previously reported in duplicates. *P<0.05.

