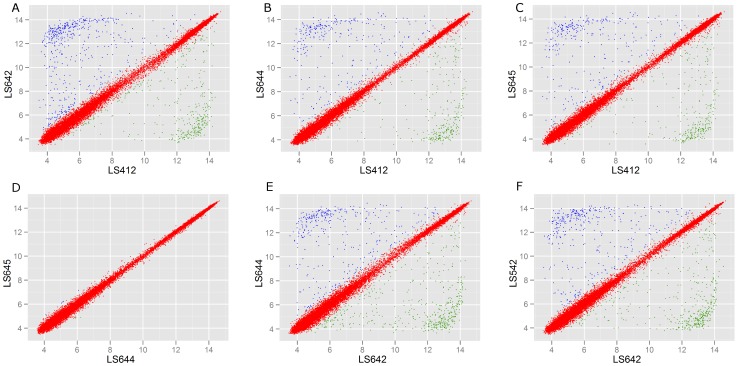
Figure 5. Scatter plots of the summarized Robust Multi-Array Averaging (RMA) intensities.
A–C, between serotypes 4b (LS412) and IVb-v1 (LS642, A; LS644, B; LS645, C). D–E, between the same serotype, IVb-v1, isolated from Australia; from the different states (LS644 and LS645, D); from the same state (LS642 and LS644, E). F, between the same serotype, IVb-v1, isolated from the different countries (LS642; Australia and LS542; USA).

