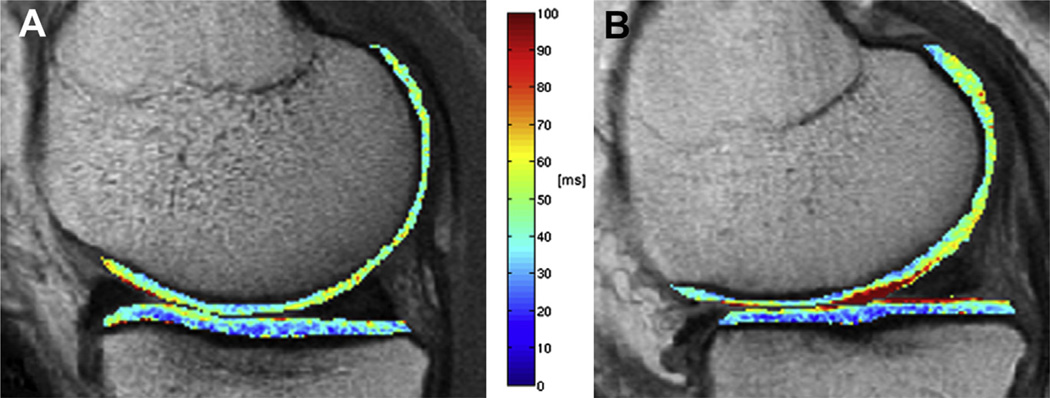
Fig. 3.
Representative color-coded, sagittal T2 maps with segmented MF and MT compartments of a normal control (A) and a subject with the OA risk factor obesity (B). Note the elevated cartilage T2 values in the obese subject compared to the normal control. A sagittal 2D multi-slice multi-echo (MSME) SE sequence was used for T2 mapping (TR of 2700 m; seven TEs of 10 ms, 20 ms, 30 ms, 40 ms, 50 ms, 60 ms, and 70 ms; slice thickness of 3 mm with 0.5 mm gap, in-plane spatial resolution of 0.313 × 0.446 mm2, acquisition time of 10.6 min).

