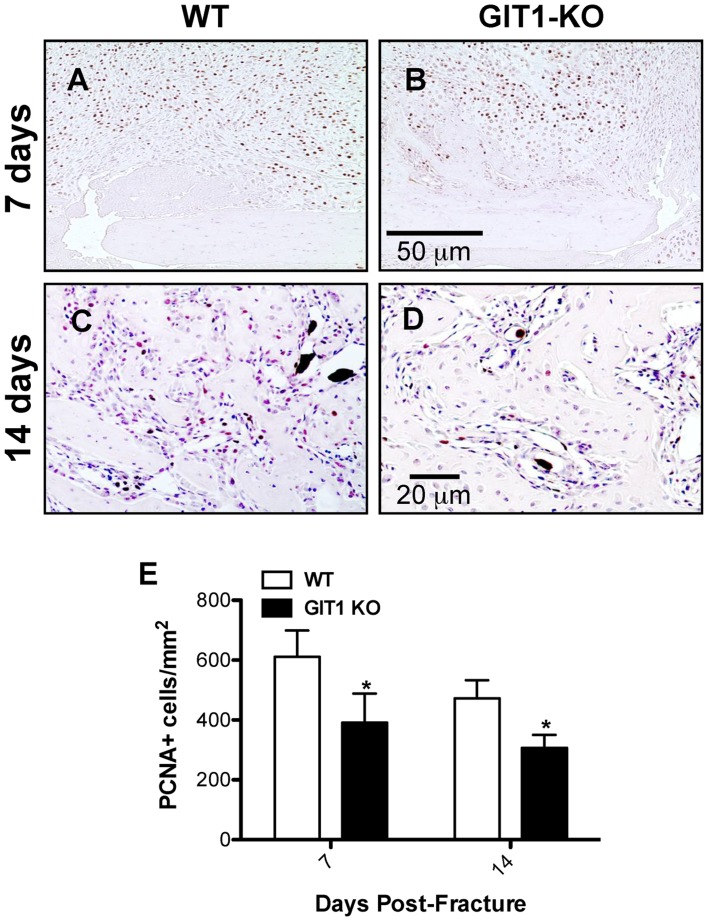
Figure 5. Chondrocyte proliferation is reduced in GIT1 KO mice.
Representative PCNA staining is shown at 7 and 14 days post-fracture in WT mice (A and C) and at 7 (B) and 14 days (D) post-fracture in GIT1 KO mice (B and D respectively). Histomorphometry was performed on triplicate sections from multiple mice to quantify the number of PCNA-positive cells per unit callus area (E). The data is presented as mean of the number of PCNA positive cells/mm2+/− SEM (*p<0.05, N = 3).

