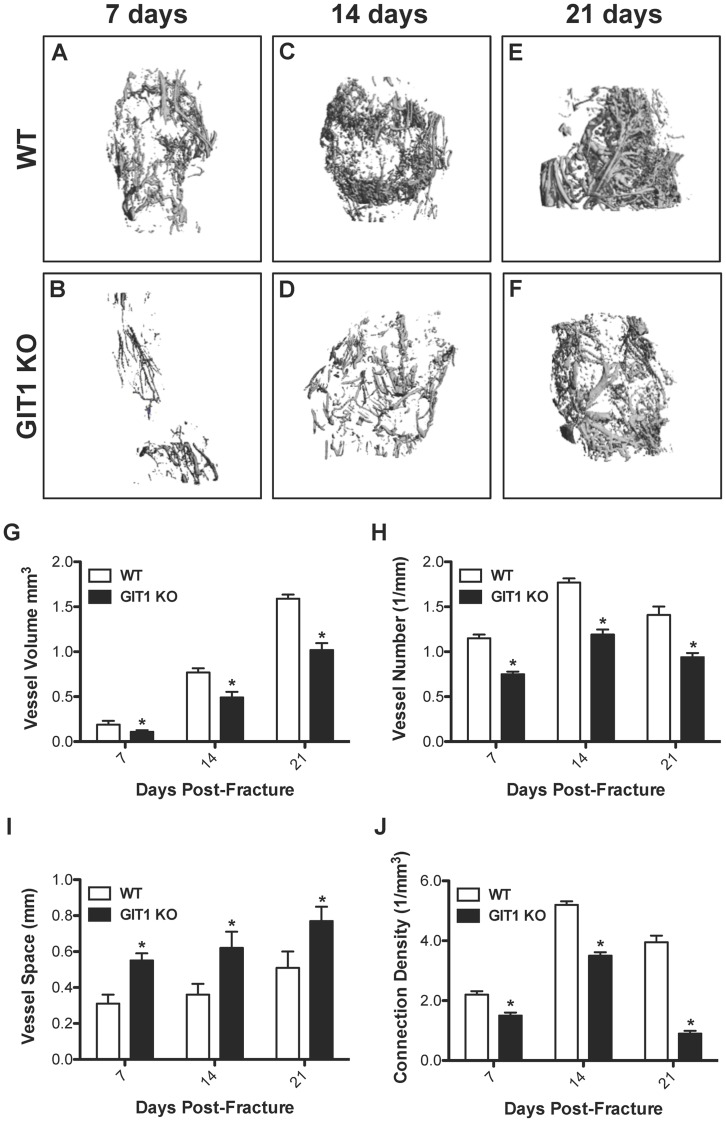
Figure 7. Fracture callus vascularity is reduced in GIT1 KO mice.
To visualize and quantify callus vascularity, WT and GIT1 KO mice were perfused with lead chromate microfilm perfusion reagent. Harvested femora were decalcified and representative vascular microCT reconstructions from each experimental group at 7, 14 and 21 days post-fracture are presented. Reduced vascularity in GIT1 KO mice (A, C, E) compared to WT control mice (B, D, F) was evident at all time points. Quantification of callus vascular parameters, including Vessel Volume (G), Vessel Number (H), Vessel Spacing (I) and Connection Density (J) supported these findings, with GIT1 KO mice possessing reduced callus vessel volume, vessel number and connection density and increased space between vessels compared to callus from WT mice. Bars represent mean for each value +/− SEM (N = 3, *p<0.05).

