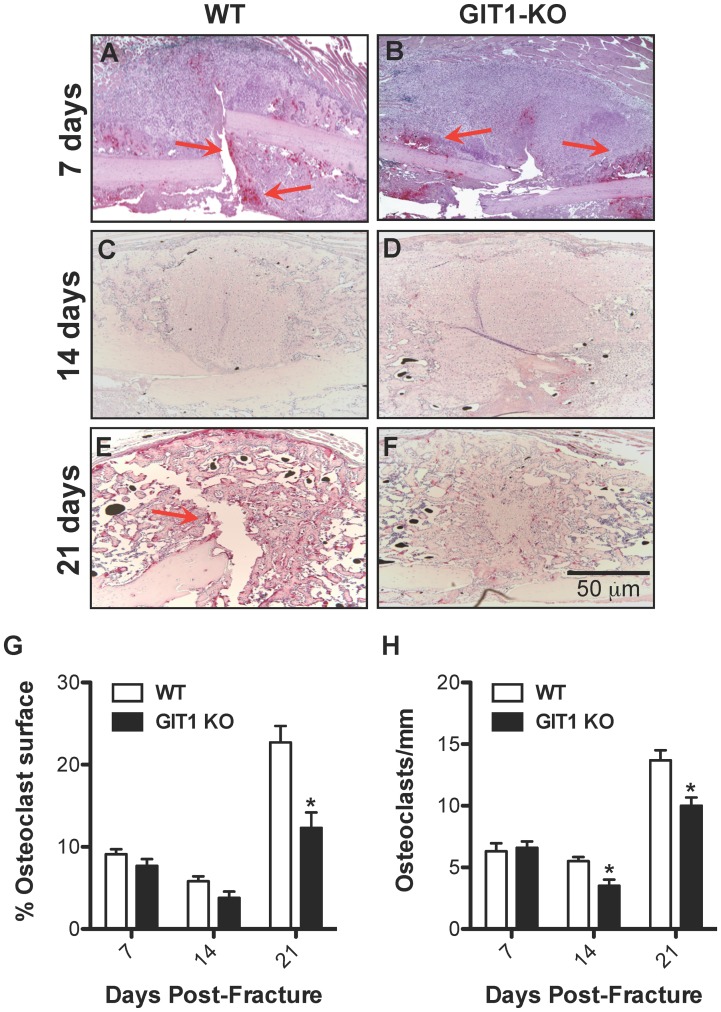
Figure 10. Osteoclast number is reduced in GIT1 KO mice.
The presence of osteoclasts in the fracture callus of WT and GIT1 KO mice was assessed at 7 (A and B respectively), 14 (C and D respectively) and 21 days (E and F respectively) post-fracture via TRAP staining. Histomorphometry to quantify percentage of osteoclast surface (G) and osteoclast number per unit bone surface (H) was also performed on triplicate sections from multiple mice, with bars representing the mean for each parameter +/− SEM (*p<0.05, N = 3).

