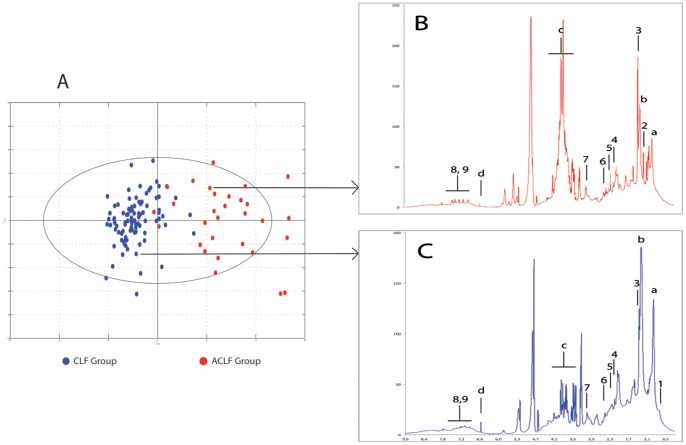
Figure 2. OPLS score plot and spectra of the CLF and ACLF patients.
A: Score plot separating CLF (blue) and ACLF (red) patients. B and C: Representative spectra showing the metabolic differences between patients with CLF or ACLF. Legends: a: -CH3 of fatty acid; b; -CH2 of fatty acid; c: glucose (C) and hydroxy-ethyl starch (B); d: fumaric acid; 1: cholesterol; 2: hydroxybutyrate; 3: lactate; 4: acetoacetate; 5: pyruvate; 6: glutamine; 7: creatinine; 8 & 9: aromatic amino acids (phenylalanine and tyrosine).

