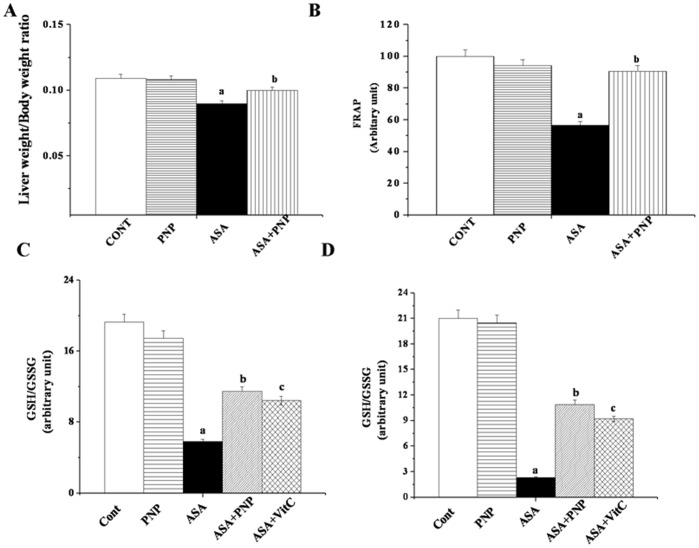
Figure 2. Effects of aspirin and PNP on the liver weight to body weight ratio and oxidative stress related parameters.
Panel A. Measurement of liver weight to body weight ratio. Panel B. Measurement of the ferric reducing antioxidant Power (FRAP). CONT: normal mice group, PNP: mice treated with only PNP, ASA: mice administrated with aspirin, ASA+PNP: mice treated with PNP after aspirin intoxication. Panel C. Effect of Aspirin and PNP on Glutathione (GSH & GSSG) activities in liver tissue. GSH to GSSG ratio. Panel D. Effect of Aspirin and PNP on Glutathione (GSH & GSSG) activities in spleen tissue. GSH to GSSG ratio. Cont: normal mice, PNP: mice treated with only PNP, ASA: mice intoxicated with aspirin, ASA+PNP: mice treated with PNP after aspirin intoxication. ASA+VitC: mice treated with vitamin C after aspirin intoxication. “a” indicates the significant difference between the normal control and ASA intoxicated groups, and “b” indicates the significant difference between ASA intoxicated (toxin) and PNP post-treated groups. Each column represents mean ± SD, n = 6; (Pa<0.05, Pb<0.05).

