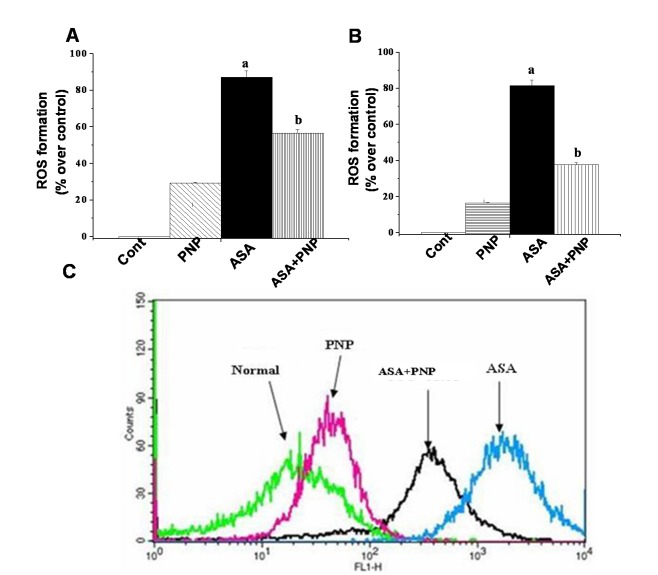
Figure 3. Effect of PNP on aspirin induced ROS production.
Panel A. Impact on ROS production in liver tissue. The intracellular ROS production was detected by FACS using DCF-DA. Normal: normal mice, PNP: mice treated with only PNP, ASA: mice intoxicated with aspirin, ASA+PNP: mice treated with PNP after aspirin intoxication. Panel B. Impact on ROS production in spleen tissue. The intracellular ROS production was measured by spectroflurimeter. Normal: normal mice, PNP: mice treated with only PNP, ASA: mice administrated with aspirin, ASA+PNP: mice treated with PNP after aspirin intoxication. Panel C. Impact on ROS production in hepatocytes. The intracellular ROS production was detected by FACS using DCF-DA. Normal: normal mice, PNP: mice treated with only PNP, ASA: mice intoxicated with aspirin, ASA+PNP: mice treated with PNP after aspirin intoxication. “a” indicates the significant difference between the normal control and ASA intoxicated groups, and “b” indicates the significant difference between ASA intoxicated (toxin) and PNP treated groups. Each column represents mean ± SD, n = 6; (Pa<0.05, Pb<0.05).

