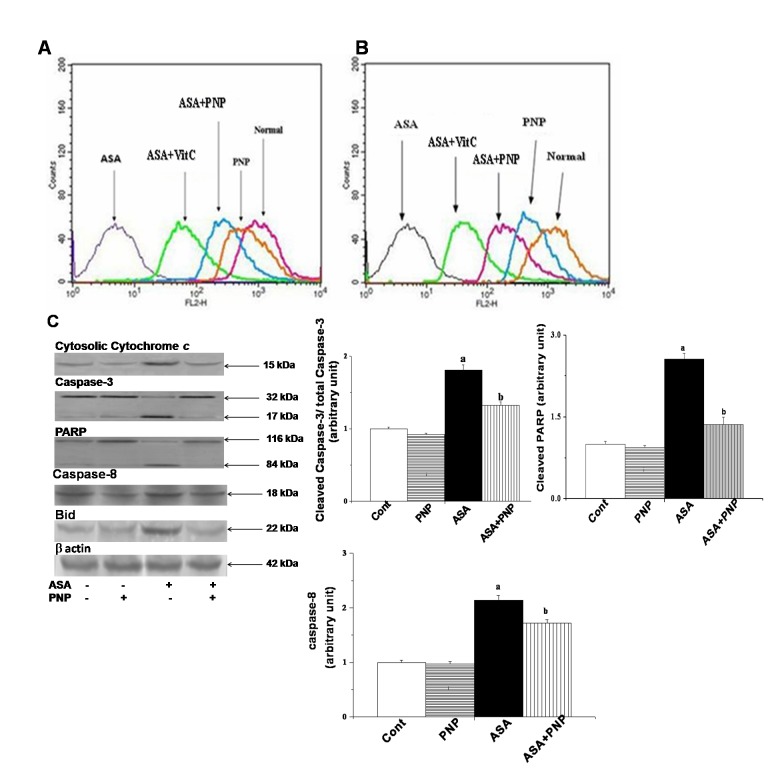
Figure 7. Impact of aspirin and PNP on the mitochondrial membrane potential and apoptotic pathways.
Panel A. Measurement of the mitochondrial membrane potential by flow cytometry analysis (using JC-1) from liver tissue homogenates, Panel B. Measurement of the mitochondrial membrane potential by flow cytometry analysis (using JC-1) from spleen tissue homogenates, Panel C. Release of cytochrome c, Total Caspase-3 and cleaved Caspase-3, Total PARP and cleaved PARP, Caspase-8, Bid. β actin was used as an internal control. Data represent the average ± SD, n = 6; (Pa<0.05, Pb<0.05). Cont: normal hepatocytes, PNP: mice treated with only PNP, ASA: mice administrated with aspirin, ASA+PNP: mice treated with PNP after aspirin intoxication. “a” indicates the significant difference between the normal control and ASA intoxicated groups, and “b” indicates the significant difference between ASA intoxicated (toxin) and PNP treated groups. Each column represents mean ± SD, n = 6; (Pa<0.05, Pb<0.05).

