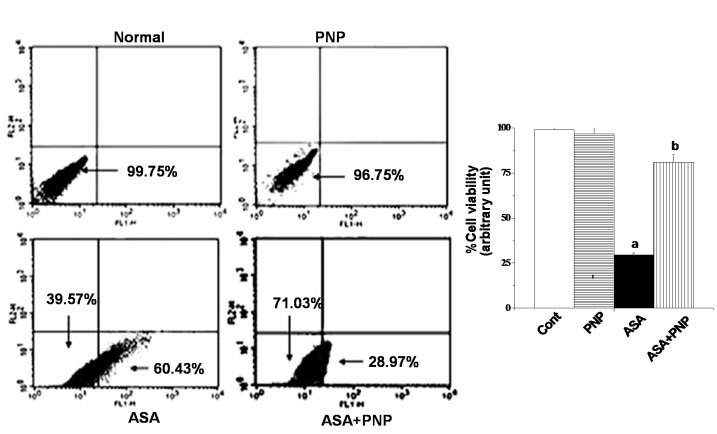
Figure 8. Measurement of apoptosis by flow cytometry analysis on hepatocytes.
Percent distribution of apoptotic and necrotic hepatocytes. Cell distribution analyzed using Annexin V binding and PI uptake. The FITC and PI fluorescence measured using flow cytometer with FL-1 and FL-2 filters, respectively. Results expressed as dot plot representing as one of the six independent experiments. The measurements were made in six times.

