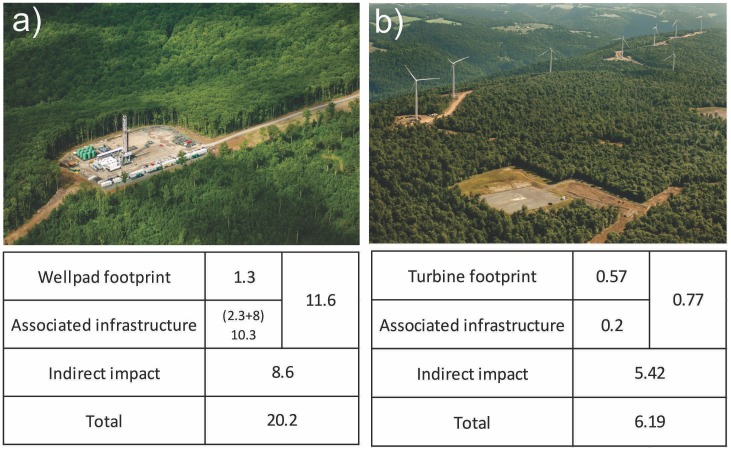
Figure 2. Photographs of shale gas footprint and wind farm footprint.
Inset table represents associated impacts in hectares used in the analysis. Estimates of potential surface disturbance associated with gas wells and wind turbines were based on measurements taken from aerial photographs from Johnson (2010) and Johnson et al. (2011). We also incorporated impacts associated with the pipelines needed to collect gas from well sites and transport it to storage areas. Measurements indicate that on average there are 2.66 km of pipeline with an average right of way of 30.48 m, where each mile of a 30.48 m right-of-way directly disturbs ∼4.86 ha/well pad. The 8.019 ha of impact associated with offsite pipelines is included in the estimate of associated infrastructure for each well pad. Because we were unable to spatially configure the location of pipelines, we summed the surface disturbance associated with each simulated well in the watershed to estimate the amount of additional surface disturbance that pipelines would create at the watershed-level. Photographs by Mark Godfrey.

