
Figure 5.
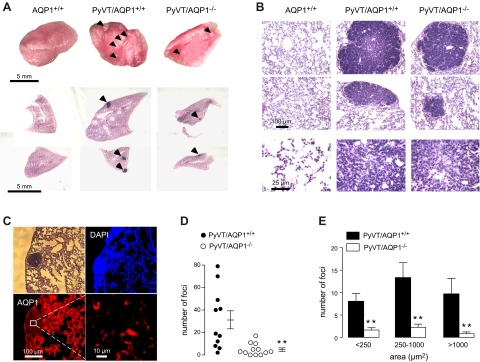
Reduced tumor metastases in lung in AQP1−/− PyVT mice. A) Gross anatomy (top panel) and low-magnification H&E-stained images of lungs showing surface tumor metastases (arrows; bottom panel) in 98-d-old female PyVT mice. B) H&E staining of lung at high magnification. C) Absence of AQP1 in tumor cells in lung metastases. D) Number of metastatic foci in AQP1+/+ and AQP1−/− PyVT mice. E) Histogram distribution summarizing metastatic nodule size (area). Values are presented as means ± se. **P < 0.005.