Figure 2.

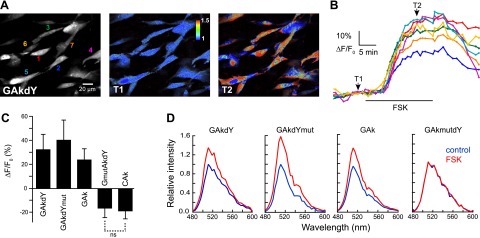
Characterization of PKA sensors in BHK cells. A) Grayscale fluorescence image shows the distribution of the GAkdY sensor in the cytoplasm and nucleus of BHK cells. Colored numbers (left panel) correspond to traces in panel B. Pseudocolor images of the same field before (T1) and during (T2) application of FSK (13 μM) illustrate the large increase in fluorescence of the GAkdY sensor on PKA activation. B) Traces show the time course and amplitude of fluorescence increases measured in the individual cells indicated in panel A. C) Mean responses of selected PKA sensors. Unless indicated (ns, nonsignificant), means are significantly different. D) Representative examples of emission spectra determined in individual cells illustrate the fluorescence increase of indicated sensors on PKA activation. No variation was observed with the inactive GAkmutdY construct. Each spectrum is the mean of 2 consecutive spectra acquired on the same cell in the presence or absence of FSK. Data were obtained using 2-photon (A–C) or 1-photon confocal microscopy (D).
