Figure 3.
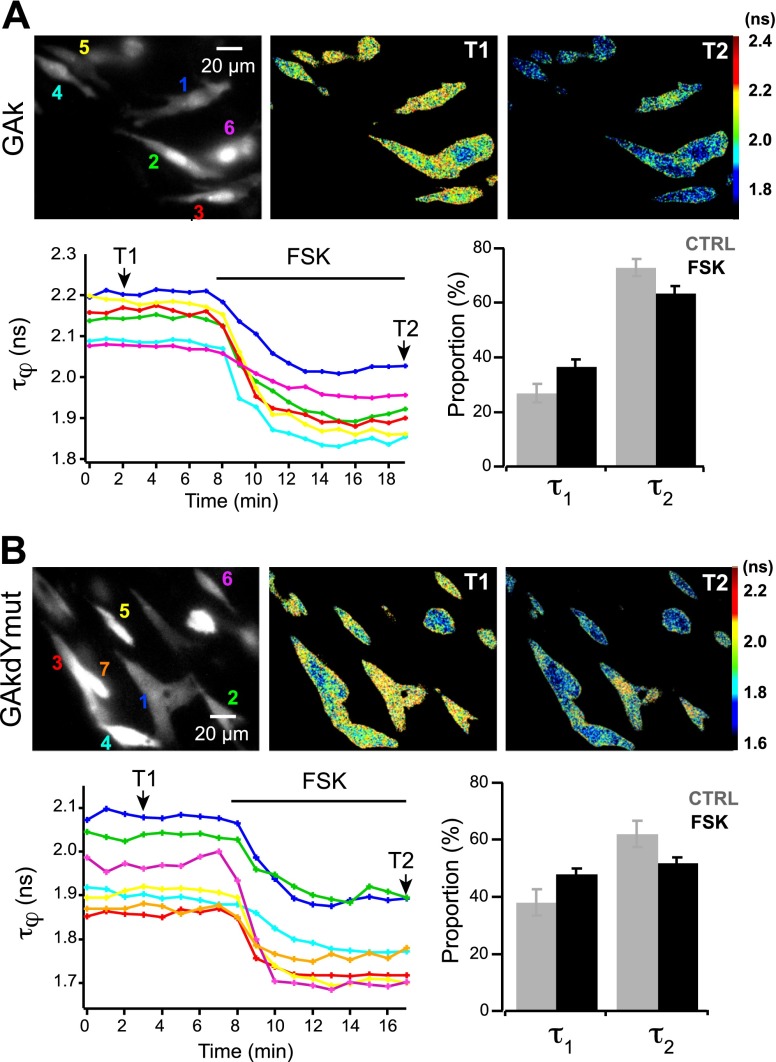
Characterization of single-fluorophore sensors using FLIM. Grayscale fluorescence images show BHK cells expressing GAk (A) and GAkdYmut (B) sensors. Pseudocolor images of the same fields before (T1) and during (T2) application of FSK (13 μM) illustrate the decrease in fluorescence lifetime τφ on PKA activation. Traces show the variations of τφ measured in individual cells indicated in the grayscale images; colors correspond to numbers in top left panels. Bar graphs show variations of the proportion of the short-lifetime (τ1) and long-lifetime (τ2) components on FSK application.

