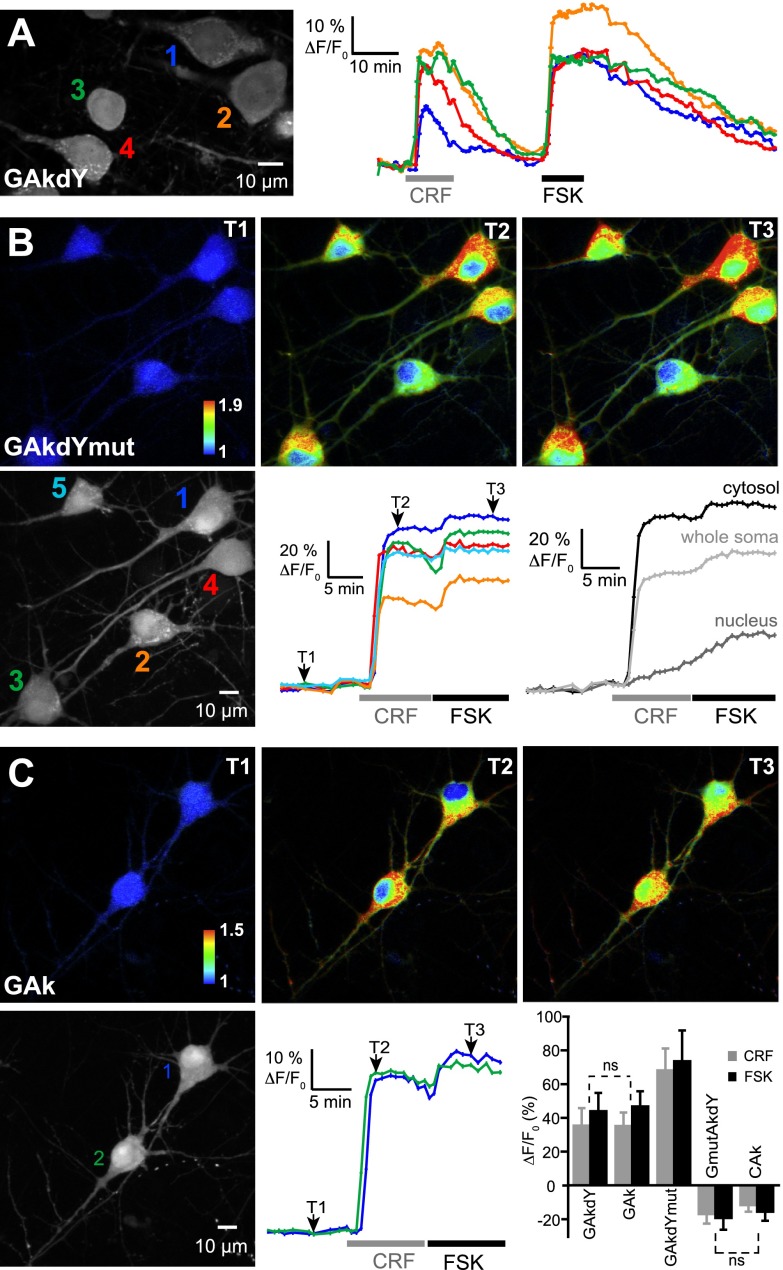
Figure 6.
Single-fluorophore sensors as PKA reporters in brain slice. Grayscale fluorescence images show cytoplasmic and nuclear expression of indicated sensors following viral transfer in neocortical pyramidal neurons. A) Traces illustrate the reversibility of sensors responses to PKA activation by CRF (250 nM) and FSK (13 μM) on washout of the drugs and the virtual absence of photobleaching in our recording conditions. B, C) Pseudocolor images show GAkdYmut (B) and GAk (C) fluorescence intensity in control (T1), CRF (T2), and FSK (T3) conditions. Color traces show the variations of fluorescence intensity measured in the somatic cytosol of individual cells indicated in the corresponding grayscale image. Grayscale traces in panel B were obtained from cell 1 and illustrate the different time course and amplitude of cytosolic and nuclear responses of the sensors. Bar graph in panel C shows mean responses of PKA sensors measured in the somatic cytosol. Unless indicated (ns, nonsignificant), mean responses significantly differed between probes.

