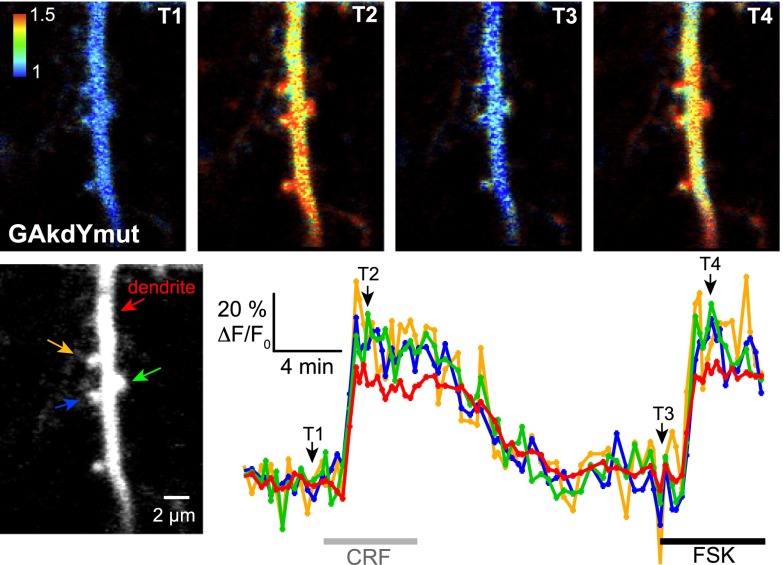
Figure 7.
Imaging PKA activity in neuronal processes. Grayscale fluorescence image shows a segment of the apical dendrite and associated spines of a pyramidal neuron expressing the GAkdYmut sensor. Traces show the variations of GAkdYmut fluorescence intensity elicited by CRF (250 nM) and FSK (13 μM) in RPIs including the dendritic shaft and 3 spines (indicated by arrows on the grayscale image). Pseudocolor images of the same field at indicated time points illustrate GAkdYmut responses on drug application.

