Figure 3.

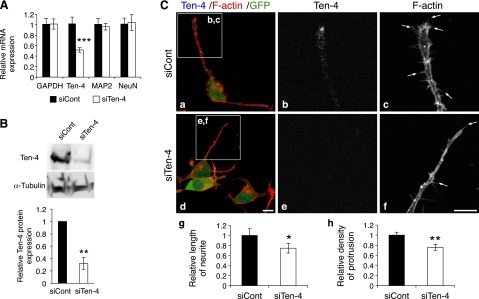
Reduced neurite outgrowth and filopodia-like protrusion formation by Ten-4 knockdown in Neuro-2a cells. A) Quantitative RT-PCR of Ten-4, MAP2, and NeuN in control siRNA-transfected Neuro-2a (siCont-Neuro-2a) or Ten-4 siRNA-transfected Neuro-2a (siTen-4-Neuro-2a) cells, 3 d after induction of neurite outgrowth. Ten-4 mRNA expression in siTen-4-Neuro-2a cells was 51.9 ± 4.4% of Ten-4 mRNA expression in siCont-Neuro-2a cells. No differences in MAP2 and NeuN mRNA expression were observed. mRNA expression of each gene was normalized using GAPDH mRNA expression. Normalized expression of each gene in siCont-Neuro-2a cells was set as 1.0. Error bars = se. ***P < 0.005; Student's t test. B) Western blot analysis of Ten-4 in siCont- and siTen-4-Neuro-2a cells, 3 d after neurite outgrowth was induced. Ten-4 expression significantly decreased in siTen-4-Neuro-2a cells (32.0±9.7% of that in siCont-Neuro-2a). Intensity of the Ten-4 bands was normalized using the intensity of the α-tubulin bands. **P < 0.01; Student's t test. C) Immunostaining of siCont- and siTen-4-Neuro-2a cells, 3 d after induction of differentiation. In siTen-4-Neuro-2a cells (d–f), the length of neurites and the density of filopodia-like protrusions were reduced, compared with those in siCont-Neuro-2a cells (a–c). F-actin staining was used to assess neurite outgrowth and protrusion formation. The GFP expression vector was cotransfected with siRNA to label transfected cells. Panels b, c and e, f show enlarged images of boxed areas in panels a and d, respectively; panels g and h denote quantitation of the length of neurites and the density of protrusions, respectively. Averaged values in siCont-Neuro-2a cells were set as 1.0. Arrows indicate filopodia-like protrusions. Scale bar = 10 μm. Error bars = se. *P < 0.05; **P < 0.01; Student's t test.
