Figure 2.
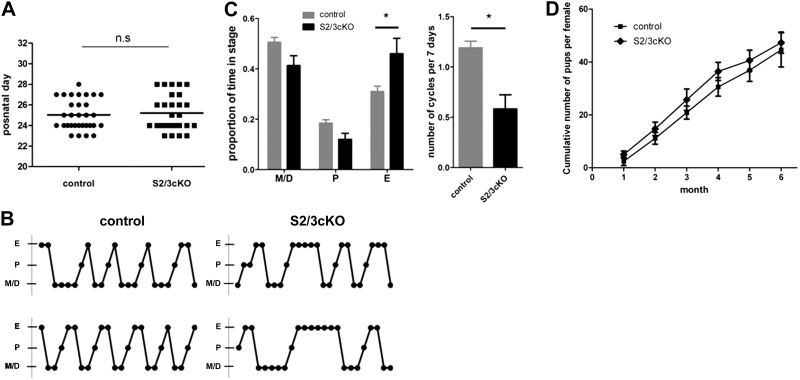
Largely intact reproductive maturation and normal fertility in S2/3cKO females. A) Day of v.o. in S2/3cKO and control mice. Each dot represents an individual mouse. Horizontal line represents the group mean. B) Representative estrous cyclicity profile from 2 control (left) and 2 S2/3cKO (right) mice. M/D, metestrus/diestrus; P, proestrus; E, estrus. C) Proportion of time spent in each cycle stage (left) and estrus cycle frequency (right) for control and S2/3cKO mice (n=7/genotype). D) Cumulative number of pups delivered per female over the course of a 6 mo breeding trial, calculated at the end of each month. Data represent means ± se of 7 mice/genotype. *P ≤ 0.05.

