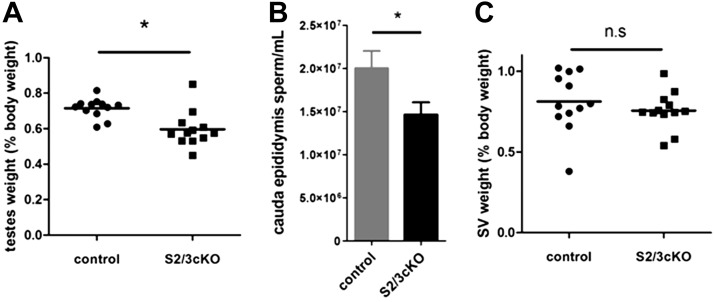
Figure 3.
Small reductions in testes weights and epididymal sperm counts in S2/3cKO males. A) Testes weight (sum of both testes), expressed as a percentage of body weight, in 10-wk-old control and S2/3cKO male mice. Each point represents an individual mouse. Horizontal line represents the group mean. B) Caudal epididymal sperm count (per milliliter of homogenization buffer) in 10-wk-old control and S2/3cKO male mice. C) Wet seminal vesicle (SV) weight, normalized to body weight in the same animals as in A. n.s., not significant. *P ≤ 0.05.

