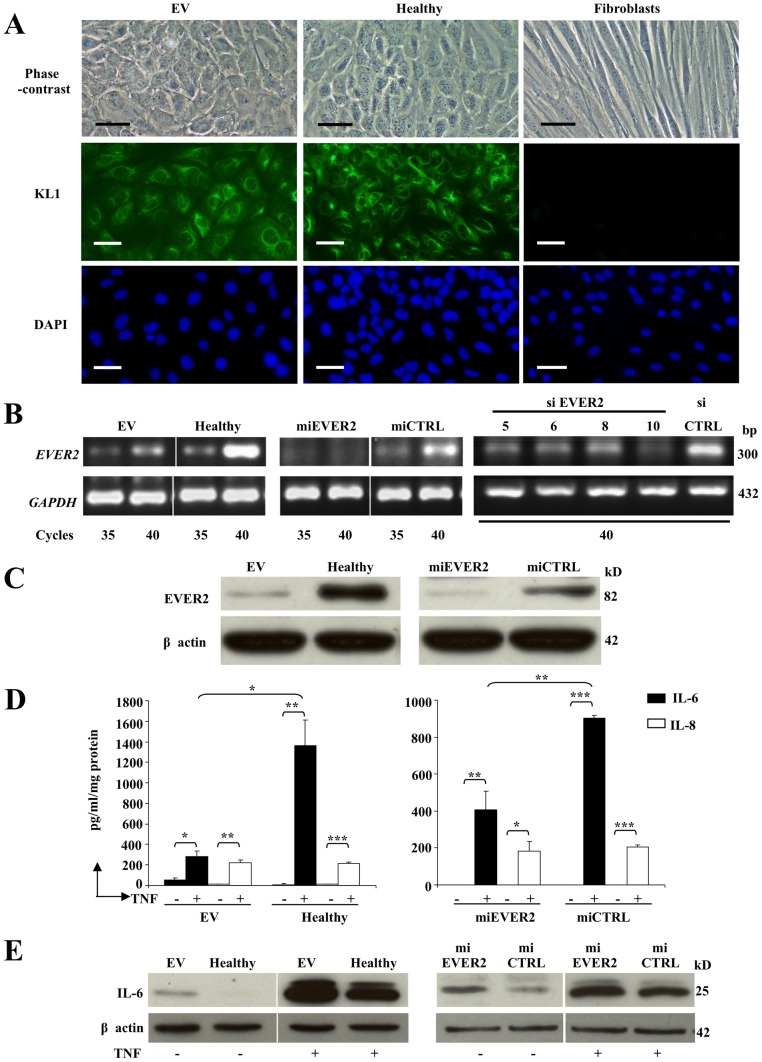
Figure 1. Characterization of cell lines.
(A) EV and Healthy cell lines were compared with fibroblasts. They were studied by phase-contrast microscopy. Bars, 50 µm. They were also stained for cytokeratin (KL1); the nucleus was stained with DAPI. Bars, 100 µm. (B–C) EVER2 expression was determined in EVER2−/− cell lines (EV and miEVER2) compared with control cell lines (Healthy and miCTRL). EVER2 transcripts (B) were studied by semiquantitative RT-PCR. Healthy cells transfected with control siRNA (siCTRL) were also compared with cells transfected with siRNAs targeting various exons (5, 6, 8 and 10) of EVER2 (siEVER2). The levels of transcripts after various numbers of cycles are shown for RT-PCR studies. GAPDH transcripts were used as the reference. The production of EVER2 protein (C) was evaluated by the western blotting of insoluble fractions isolated from the cells. The data shown are representative of three independent experiments. (D–E) IL-6 production was studied in EVER2−/− (EV and miEVER2) and wild-type (Healthy or miCTRL) cells. The cells were cultured in the presence or absence of TNF. (D) After 48 h, the supernatants were collected and tested for IL-6 and IL-8 by flow cytometry. Data are means ± SD of three independent experiments. (E) After 16 h in the presence of brefeldin A, whole-cell lysates were assayed for intracellular IL-6 by western blotting. Data are from one experiment representative of three independent experiments carried out. *, P<0.05; **, P<0.01; ***, P<0.001.

