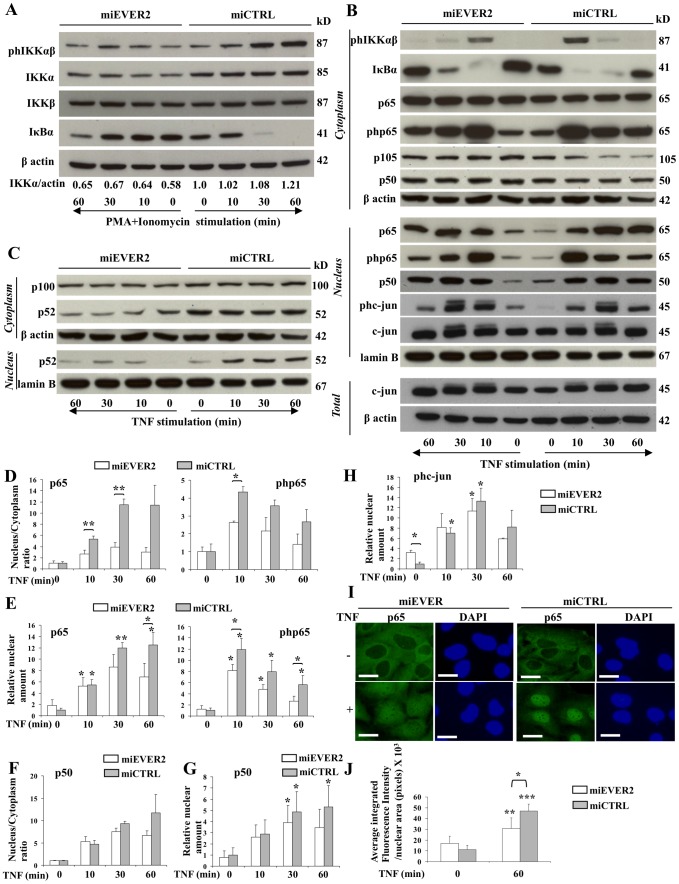
Figure 3. Function of EVER2 in NF-κB and c-jun activation.
miEVER2 and miCTRL cell lines were left untreated or were stimulated with PMA+ionomycin (A) or TNF (B–J) for the times indicated. (A) Whole-cell lysates were analyzed by western blotting to explore the IKKαβ complex. The phosphorylated forms of IKKαβ are indicated as phIKKαβ. The IKKα and actin bands on western blots were quantified by densitometry. Results are reported as the ratio of IKKα to actin. The ratio obtained for the miCTRL cell line at time 0 was set to 1. (B–C) Cytoplasmic and nuclear fractions were analyzed for the classical NF-κB and AP-1 axis (B) or for the alternative NF-κB axis (C). The phosphorylated forms of p65 and c-jun are indicated as php65, and phc-jun respectively. Whole-cell lysates (Total) were analyzed for total c-jun expression. (D–H) Bands on western blots were quantified by densitometry. (D–E) The amounts of p65 and phosphorylated p65 (php65) were quantified in nuclear and cytoplasmic fractions, following stimulation with TNF. The results are reported as the ratio of nuclear and cytoplasmic concentrations (D). The ratios for basal levels were set to 1. (E) The amounts of p65 and php65 in nuclear fractions are reported. Basal levels of miCTRL were set to 1. (F–H) Subcellular extracts were assayed for p50 and the phosphorylated form of c-jun (phc-jun). For p50, the results are reported as the ratio of nuclear and cytoplasmic concentrations (F). Ratios for basal levels were set to 1. Total amounts of p50 (G) and phosphorylated c-jun (phc-jun) (H) in the nuclear fraction of cells are reported. Basal levels of miCTRL were set to 1. Data are means ± SD of three independent experiments. Statistically significant differences between the results for two cell lines are indicated by asterisks over the brackets. Asterisks over error bars indicate statistically significant differences in the results between unstimulated and TNF-stimulated cells. (I–J) Keratinocytes from the miEVER or the miCTRL cell lines were left untreated or were treated with TNF for 1 hour and stained for NF-κB (p65); the nucleus was stained with DAPI (I). Bars, 20 µm. (J) The fluorescence intensity of nuclear p65 was quantified before and after stimulation. Asterisks over error bars indicate statistically significant differences in fluorescence intensity between unstimulated and TNF-stimulated cells. Statistically significant differences between the two cell lines are indicated by asterisks over the brackets. *, P<0.05; **, P<0.01; ***, P<0.001.

