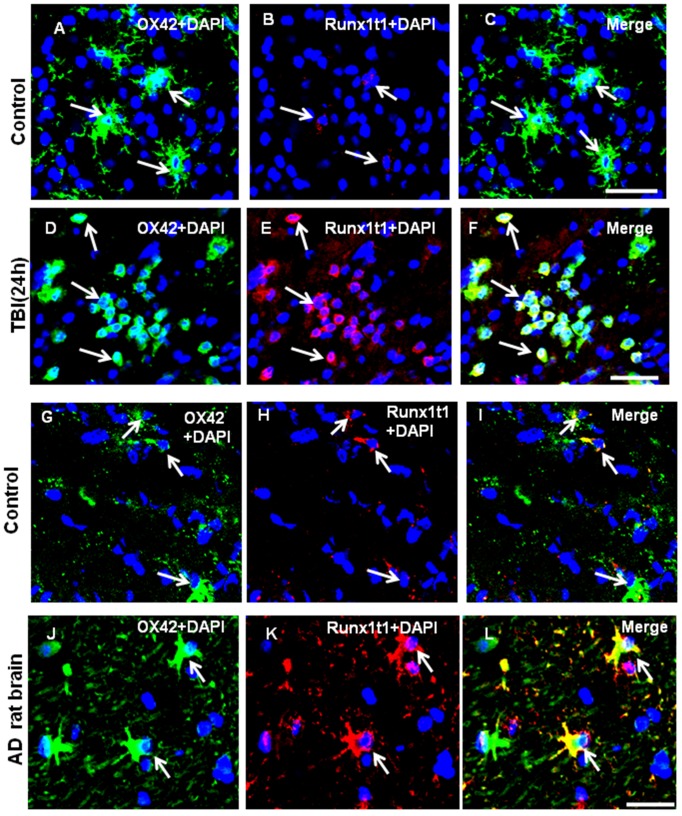
Figure 4. Runx1t1 protein expression in the activated microglial cells of TBI and AD rat brain models.
A–L. Confocal images showing the colocalization of Runx1t1 (Red) and OX42 (Green) in activated microglia in the CA1 region of hippocampus from TBI (A–F) or AD (G–L) rat models. Control sections were obtained from the sham-operated rat brains (A–C). Runx1t1 expression appears to be increased in activated microglial cells 24 h after TBI (D–F; arrows) when compared with control (A–C). G–L. Runx1t1 expression appears to be increased in activated microglial cells in the hippocampus of Alzheimer’s rat model (J–L) when compared to control sections (G–I). Nuclei are stained with DAPI. Scale bars: 50 µm.

