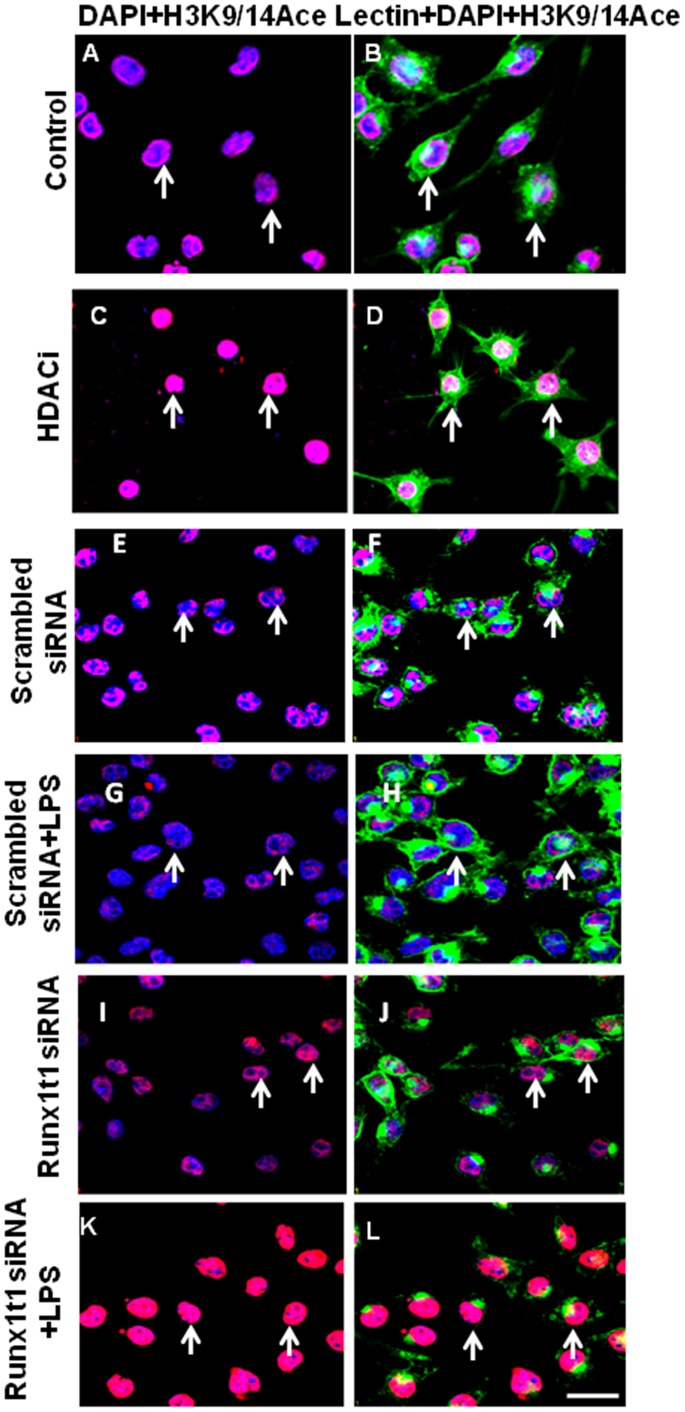
Figure 9. Confocal images showing acetyl-histone H3 (K9/14) immunostaining (Red) in BV2 microglial cells which are counterstained with lectin (Green) and DAPI (Blue).
HDACi treatment increased acetyl-histone H3 staining in microglial cells(C,D) when compared to control cells (A,B). Further, knockdown of Runx1t1 markedly increased acetyl-histone H3in microglial cells treated with or without LPS (I–L) when compared to scrambled siRNA transfected cells (E–H). Scale bars: 50 µm.

