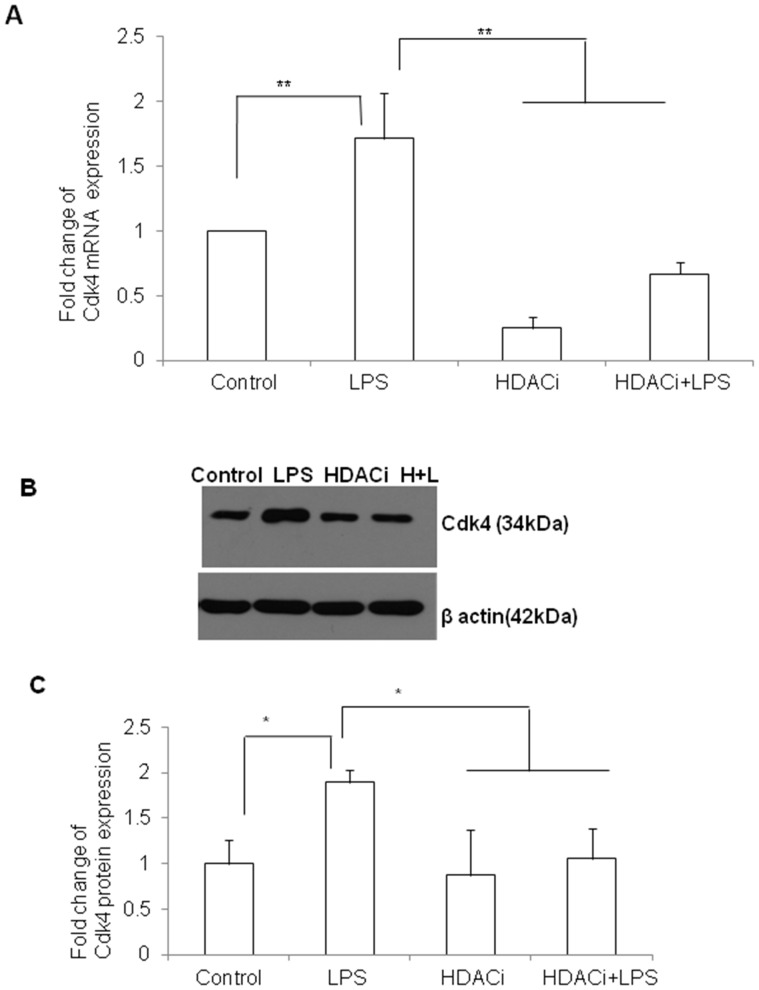
Figure 10. Cdk4 mRNA and protein expression in BV2 microglia treated with HDACi.
A. qRT-PCR analysis shows that Cdk4 mRNA expression is significantly upregulated in LPS-treated BV2 microglia and however, downregulated when cells are treated with HDACi. B–C. Western blot analysis also showed a similar trend ofCdk4 (34 kDa) expression in BV2 microglia treated with HDACi or LPS or both. The data are normalized with β-actin (42 kDa) immunoreactivity (B). Significant differences between groups (control vs LPS, LPS vs HDACi and LPS vs HDACi +LPS) are indicated by *p<0.05, **p<0.01 (n = 3).

