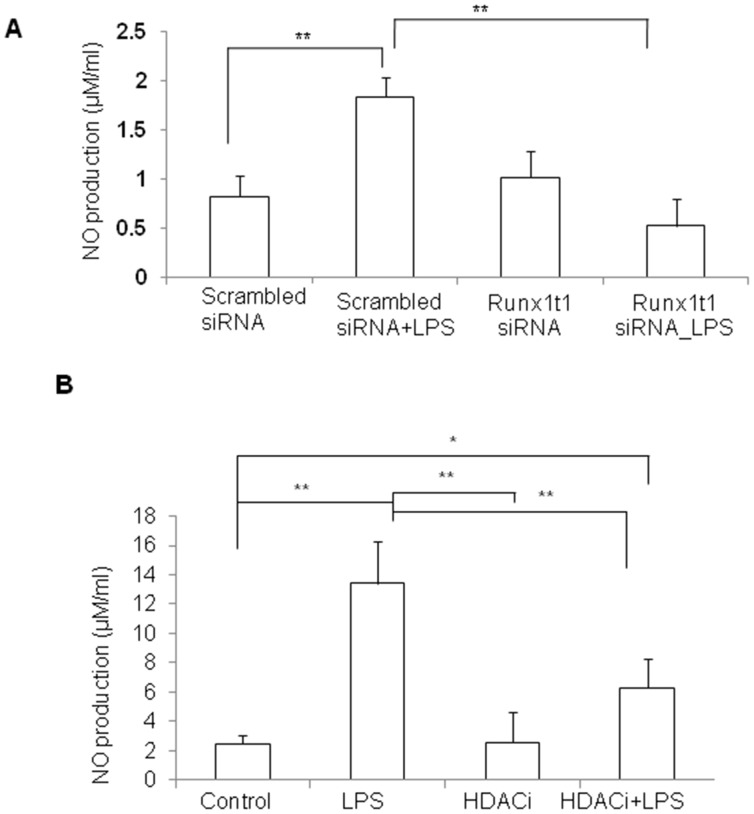
Figure 13. NO productionin BV2 microglia transfected with Runx1t1 siRNA or treated with HDACi.
A–B. Nitric oxide (NO) assay analysis indicates that nitrite level is significantly increased in LPS-treated BV2 microglial cells and is brought down to near base level either by Runx1t1 siRNA knockdown(A) or by HDACi treatment (B). Significant differences between groups (scrambled siRNAvs scrambled siRNA +LPS, scrambled siRNA +LPS vs Runx1t1 siRNA+LPS, control vs LPS, control vs HDACi+LPS, LPS vs HDACi, LPS vs HDACi+LPS) are indicated by *p<0.05, **p<0.01 (n = 3).

