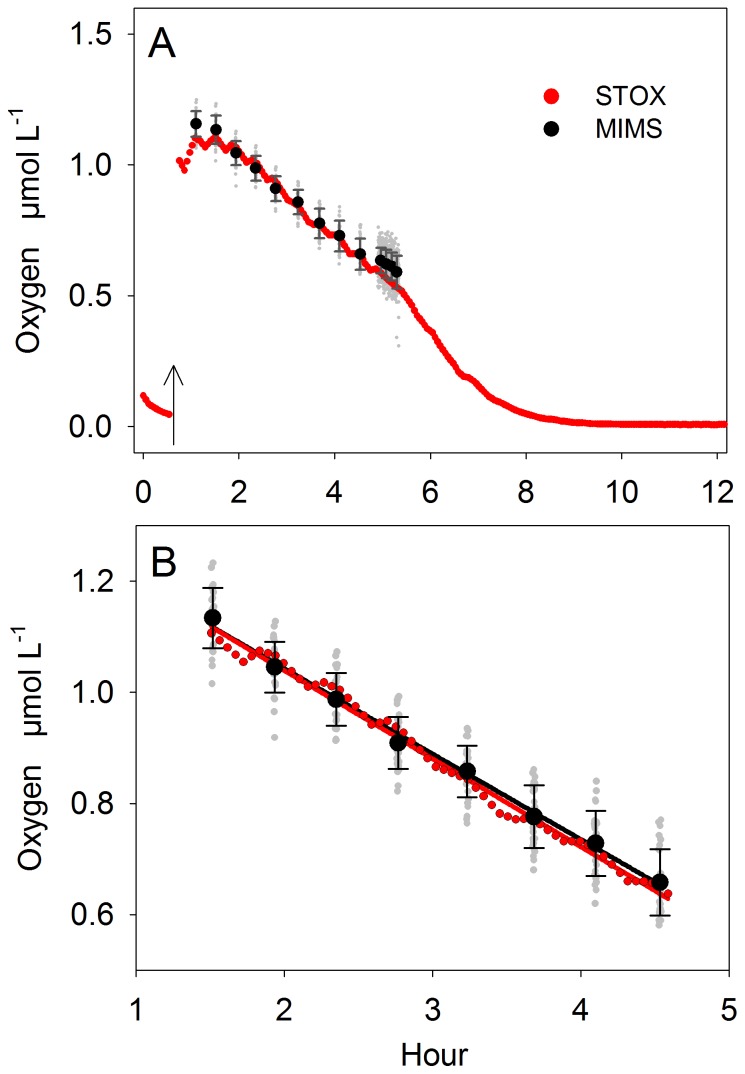
Figure 5. Experiment 2: Comparing MIMS and STOX sensor.
O2 concentration and consumption rates measured after the addition of 1.2 µmol 18-18O2 L−1 (arrow) (A). Individual MIMS measurements (grey dots) are averaged (black dots) and presented with the respective standard deviation. From the entire experimental run 3 hours of simultaneous measurements (B) were used for rate calculations.

