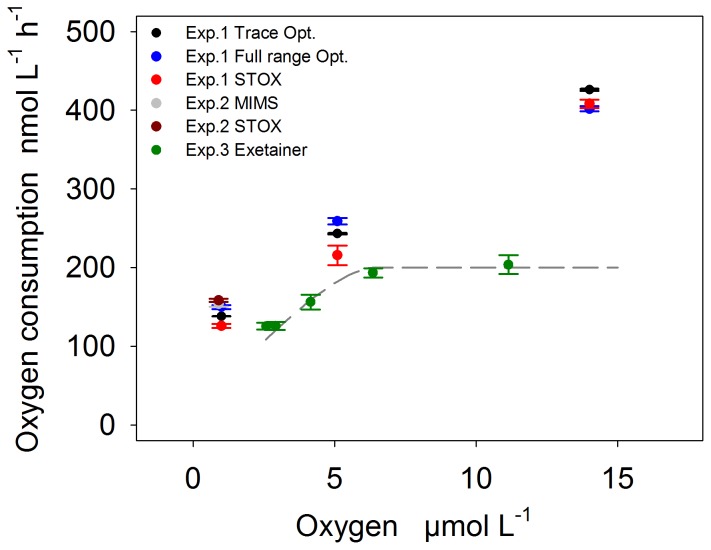
Figure 7. O2 consumption rates versus O2 concentrations.
The O2 consumption rates of Experiment 1, 2 and 3 are summarized and plotted over the initial O2 concentrations of the respective incubation. Experiment 3: The dashed line represents diffusion limited rates estimated from equation 4 assuming aggregate diameters (r0) of 0.14 mm. Please note: rates in Experiment 1 also increase with incubation time and could as well reflect bacterial growth over time.

