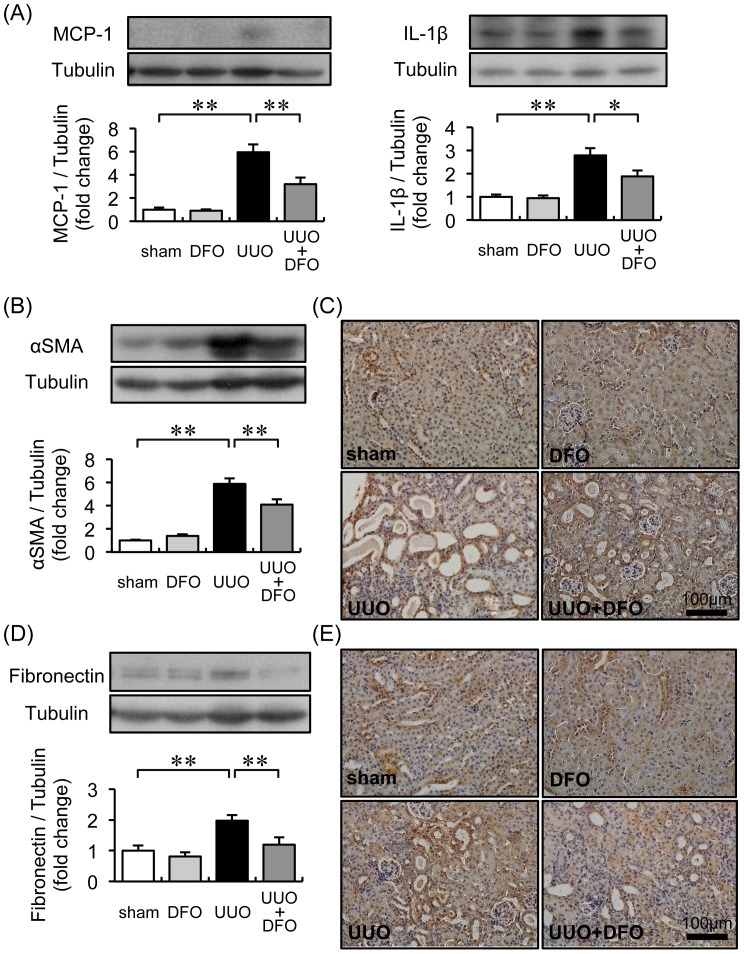
Figure 2. Effect of iron chelation on protein expression related to inflammation and the extracellular matrix.
(A) Analysis of the renal expression of MCP-1 and IL-1β. Upper panels: representative immunoblotting for MCP-1 and IL-1β. Lower panels: quantitative analysis of MCP-1 and IL-1β expression normalized to tubulin. Results are expressed as the mean ± SEM. *P<0.05, **P<0.01. n = 12 per group. (B) Quantitative analysis of αSMA expression. Results are expressed as the mean ± SEM. *P<0.05, **P<0.01. n = 12 per group. (C) Representative immunochemistry results for αSMA expression in kidney sections. (D) Quantitative analysis of fibronectin expression normalized to tubulin. Results are expressed as the mean ± SEM. *P<0.05, **P<0.01. n = 12 per group. (e) Representative immunochemistry results for fibronectin expression in kidney sections.

