
Figure 5. Total FAK was unchanged by TREK-1 deficiency, but FAK phosphorylation at Tyr925 residue was increased in TREK-1 deficient cells, while Tyr397 phosphorylation was decreased in stretched cells.
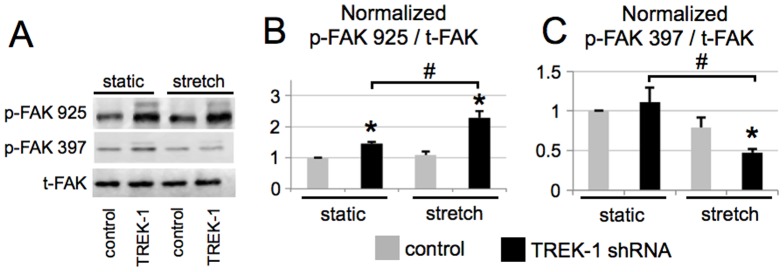
(A) Representative Western blots of FAK Tyr397 and Tyr925 phosphorylation in control and TREK-1 deficient cells under no stretch (static) and stretched (20%, 15 cycles/min for 8 hours) conditions. (B) Summary of densitometric band analyses of 3 Western blot experiments for Tyr925 and for Tyr397 (C). In (B) and (C) the ratio of phosphorylated FAK (p-FAK) to total FAK (t-FAK) was normalized to the ratio for unstretched control cells. *p<0.05, compared to unstretched control cells; # unstretched TREK-1 deficient control cells compared to stretched TREK-1 deficient cells; n = 3-4.