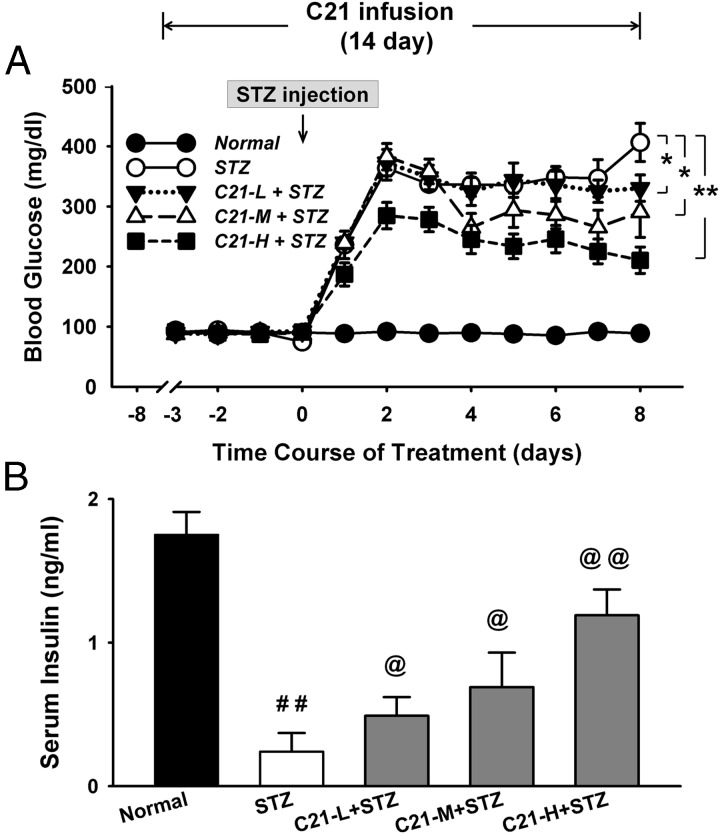
Figure 2.
Blood glucose concentration over the 2-week experimental period (A) and serum insulin concentration on day 8 after STZ injection (B). *, P < .05 and **, P < .01 between the indicated groups (n = 12 each group); ##, P < .01 compared with normal group; @, P < .05 and @@, P < .01 compared with the STZ group (n = 6 each group). C21-L, -M, and -H, Low-, middle-, and high-dose C21.

