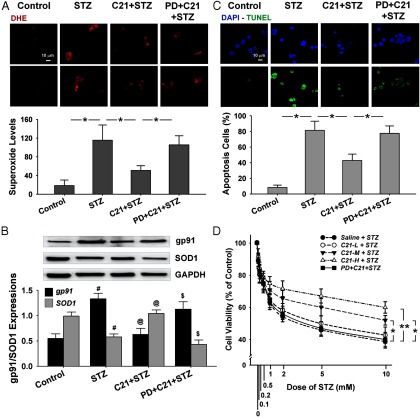
Figure 6.
Effects of C21 on oxidative stress, apoptosis, and cell viability in cultured INS-1E cells. A, Superoxide levels by DHE staining. B, Protein expressions of gp91 and SOD1 by Western blot. C, Apoptosis by TUNEL staining. D, Cell viability by MTT assay. *, P < .05 and **, P < .01 between the indicated groups; #, P < .05 vs control; @, P < .05 vs STZ; $, P < .05 vs C21 + STZ. The cells counted in panels A and C are from 14 to 31. The experiments for panels B and D were done in triplicate. C21-L, -M, and –H, Low, middle, and high concentration of C21.

