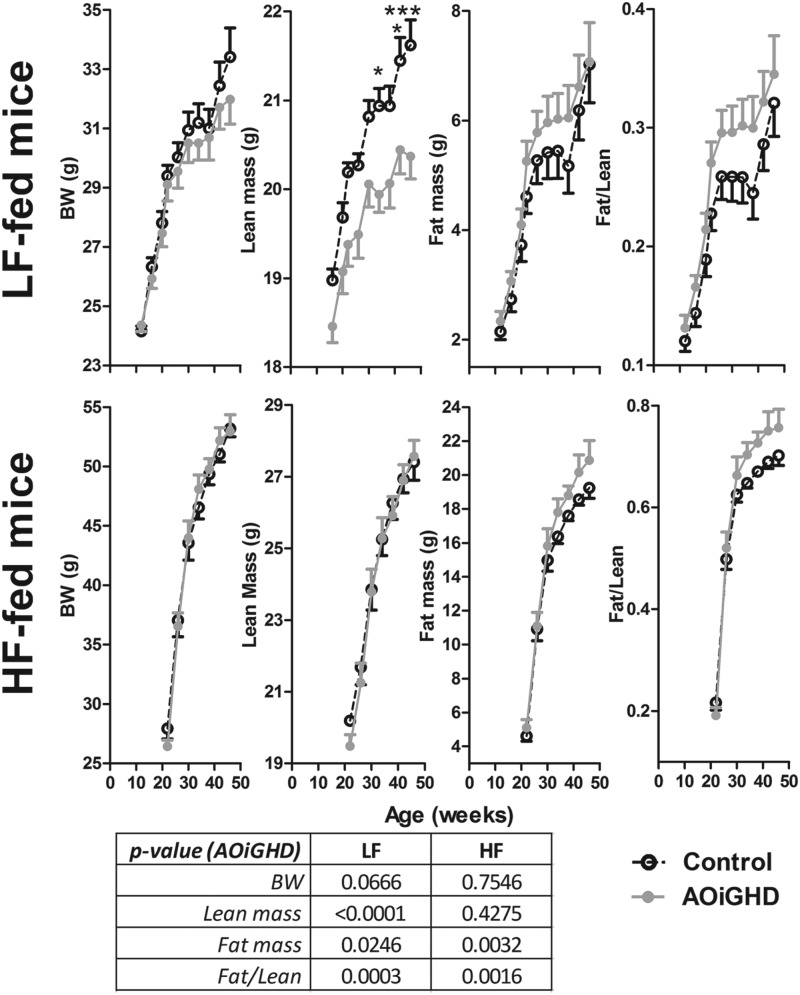
Figure 2.
Body composition (body weight, fat/lean, lean, and fat mass) of LF- or HF-fed AOiGHD from 12 to 46 weeks of age. Values are means ± SEM of 10–14 mice/group per diet and were analyzed by two-way ANOVA within diet, and P values for the overall effect of AOiGHD across diet are provided in the lower panel. Asterisks (*, P < .05; ***, P < .001) indicate values that significantly differ between genotype, within diet, as assessed by Bonferroni's post hoc comparisons. BW, body weight.

