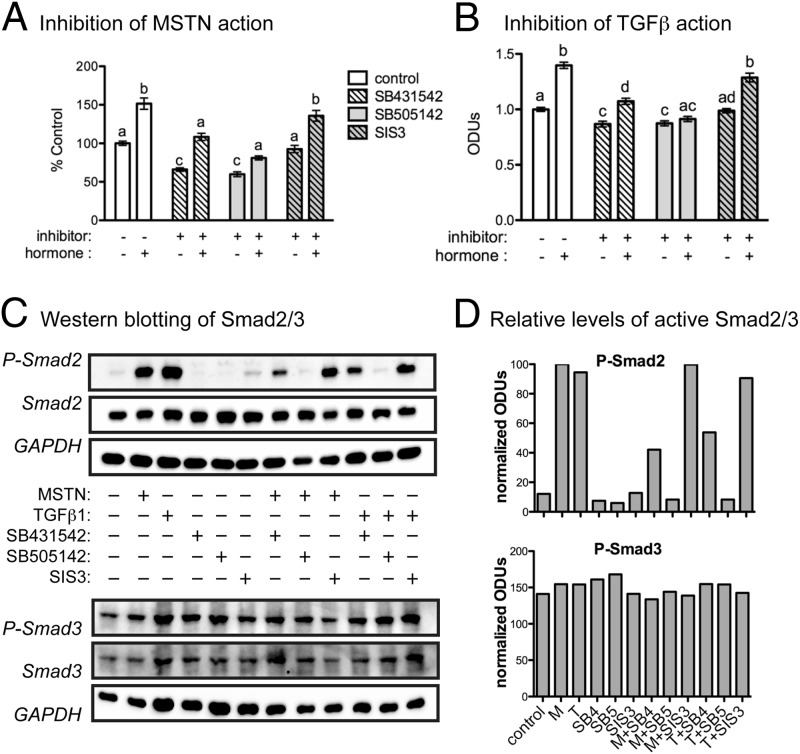
Figure 4.
Myostatin and TGFβ1 activation of Smad2/3. A and B, Cells were cultured in serum-free (SF) DMEM/0.1% BSA for 48 hours in the absence (−) or presence (+) of 20 nM recombinant human myostatin (rhMSTN) (15), 0.04 nM TGFβ1, 1 μM of the indicated inhibitors, or combinations of hormones and inhibitors (Alk4/5, 431532; Alk5, 505142; Smad3, SIS3). Significant differences in cell number, among all groups, are indicated by different letters whereas the same letters signify no difference (P ≤ .05). C, Cells were treated in SF DMEM/0.1% BSA with the indicated combinations of hormones and inhibitors for 1 hour. Levels of total and phospho (P)-Smad2/3 were then estimated by Western blotting of cellular lysates. D, Relative levels of Smad2/3 activation were estimated by normalizing optical density units (ODUs) of P-Smad2/3 to total Smad2/3 and glyceraldehydes-3 phosphate dehydrogenase (GAPDH). Bars are labeled on the x-axis in the same order as samples in panel C (M, myostatin; T, TGFβ1; SB4, 431542; SB5, SB505142).

