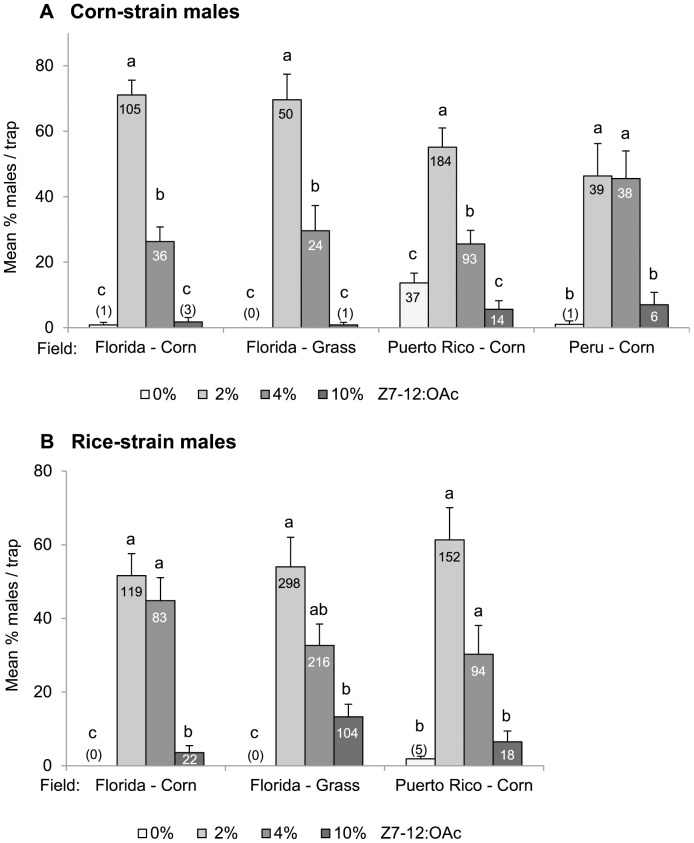
Figure 2. Attraction of corn-strain (A) and rice-strain (B) males to different doses of Z7-12:OAc.
Bars represent the mean percentage of males caught per trap (0%, 2%, 4%, or 10% Z7-12:OAc +100% Z9-14:OAc) and per biological replicate (n = 3). Different letters above the bars indicate significant differences. Error bars show the variation between biological replicates (n = 3). Numbers in brackets/bars represent the total number of males caught. Data from Florida are adapted from [52].

