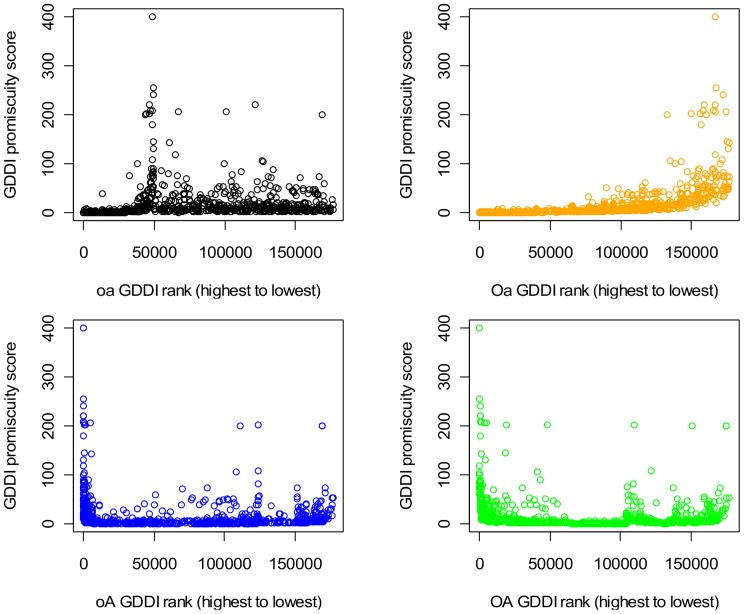
Figure 11. Scatter-plot of GDDI rank vs. promiscuity, scenario A Pe = 1.0.
All the 177,233 putative DDIs were ranked as described in the text, and the ranks of GDDIs were extracted to create the plots. Promiscuity of a domain pair (a, b) = [N(a)+N(b)]/2 where N(d) is the number of times domain d occurs in a protein set. Only the concept lattices which are not attribute-reduced (OA and oA) exhibit the desired negative relationship, which means they tend to rank promiscuous GDDIs more highly. The relationship is strongly positive when the Oa rankings are used. Oa results are identical to the Associative method which is known to penalize promiscuous domain-pairs. There is also a tendency for the oa concept lattice to rank promiscuous GDDIs less highly, but this positive relationship is not so apparent because scoreless GDDIs are included in the plot (they start at rank 49,378 and onwards to the right of the plot). When the oa concept lattice is used, only 350 of the 783 GDDIs have CB scores; the remaining GDDIs are scoreless and are ranked randomly but below the GDDIs with CB scores. The same pattern of relationships is observed with evaluation scenarios B and C (Figures S11 and S12 in File S1).

