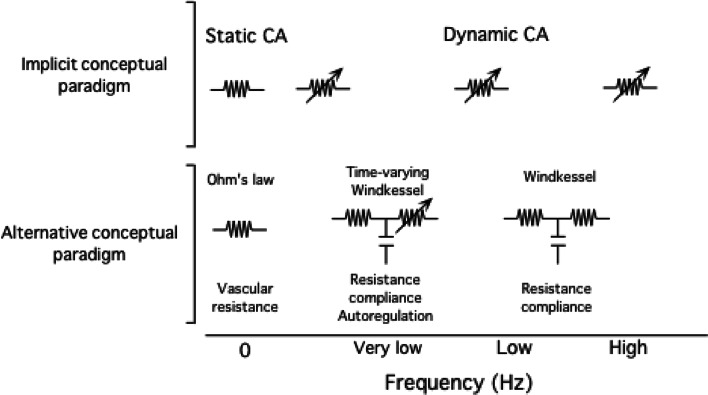
Fig. 6.
Schematic diagram illustrating how different conceptual paradigms can influence data interpretation. The top panel shows the popular implicit paradigm that assumes cerebral autoregulation (CA) as the principal determinant of cerebral pressure–flow velocity relationships. The bottom panel shows one potential alternative paradigm that accounts for inherent vascular properties such as resistance and compliance in addition to CA. Such alternative models require further experimental validation. Potential influences due to other processes such as neurovascular coupling and partial pressure of arterial are not shown

